Data has become one of the most valuable assets for modern organizations. Every interaction, transaction, campaign, customer touchpoint, and operational process generates data that can be used to drive better decisions. However, as businesses grow, so does the complexity of managing and analyzing that data.
Today, organizations often rely on multiple systems to collect, store, process, and visualize information. Marketing teams may use Google Analytics and advertising platforms. Sales teams work within CRM systems such as Salesforce or Dynamics 365. Finance departments depend on ERP systems, while operations teams use specialized applications to manage supply chains, inventory, and logistics.
While these systems provide valuable information individually, the real challenge lies in bringing everything together.
Many organizations struggle with:
Traditional analytics environments often require separate tools for data integration, storage, transformation, warehousing, reporting, and advanced analytics. As a result, businesses spend significant time and resources maintaining technology stacks rather than focusing on generating insights.
This is where Microsoft Fabric enters the picture.
Microsoft Fabric represents a significant shift in how organizations approach analytics. Instead of managing multiple disconnected technologies, Microsoft Fabric provides a unified platform that combines data engineering, data integration, data science, data warehousing, business intelligence, real-time analytics, and artificial intelligence into a single ecosystem.
Built as a Software-as-a-Service (SaaS) platform, Microsoft Fabric simplifies analytics architecture while enabling organizations to scale data operations more efficiently. By centralizing analytics workloads under one platform, businesses can improve collaboration, strengthen governance, reduce complexity, and accelerate decision-making.
Whether you're a business leader exploring modern analytics solutions, an IT team evaluating enterprise data platforms, or a data professional seeking to understand Microsoft's latest innovation, this guide will help you understand what Microsoft Fabric is, how it works, and why it is rapidly becoming a cornerstone of modern enterprise analytics.
Microsoft Fabric is Microsoft's unified analytics platform that combines data integration, data engineering, data science, data warehousing, real-time analytics, business intelligence, and AI-powered insights into a single cloud-based environment.
Rather than requiring organizations to deploy and manage separate products for different analytics functions, Microsoft Fabric provides a centralized platform where the entire data lifecycle can be managed from one place.
At its core, Microsoft Fabric is designed to help organizations move from raw data to actionable insights more efficiently. The platform enables businesses to:
All of these capabilities operate within a common architecture and user experience. Unlike traditional analytics stacks where each workload operates independently, Microsoft Fabric creates a connected ecosystem that enables seamless collaboration between data engineers, analysts, business users, executives, and data scientists.
1.1 Microsoft Fabric Explained in Simple Terms
Think of Microsoft Fabric as a complete analytics operating system for your business. Imagine a company that uses:
In a traditional environment, these systems often operate independently, requiring complex integrations and multiple reporting tools. Microsoft Fabric provides a centralized environment where all of these data sources can be connected, standardized, analyzed, and visualized.
Instead of asking:
organizations can work from a unified data foundation. This significantly reduces complexity while improving visibility across the business.
1.2 Microsoft's Vision for Fabric
Microsoft's long-term vision for Fabric is to create a unified analytics ecosystem where every data professional can work together without switching between disconnected platforms. Historically, organizations have needed separate tools for:
| Analytics Function | Traditional Solution |
|---|---|
| Data Integration | ETL Platforms |
| Data Storage | Data Lakes |
| Data Warehousing | Data Warehouses |
| Reporting | BI Tools |
| Data Science | ML Platforms |
| Real-Time Analytics | Streaming Platforms |
| Governance | Separate Security Tools |
Microsoft Fabric brings these capabilities together into a single platform. This approach reduces operational complexity while creating a more connected analytics experience.
1.3 Is Microsoft Fabric a SaaS Platform?
Yes, one of the most important aspects of Microsoft Fabric is that it is delivered entirely as a Software-as-a-Service (SaaS) platform.
Unlike traditional on-premises analytics environments, organizations do not need to manage:
Microsoft handles the underlying infrastructure while organizations focus on generating business value from data. This SaaS-first approach allows companies to deploy analytics capabilities faster while reducing administrative overhead.
1.4 How Microsoft Fabric Relates to Power BI
A common misconception is that Microsoft Fabric is simply a replacement for Power BI. In reality, Power BI is a core component within the broader Microsoft Fabric ecosystem.
Power BI continues to provide:
However, Fabric extends beyond reporting by adding capabilities such as:
This means organizations can manage the entire analytics lifecycle without leaving the Microsoft ecosystem. Rather than replacing Power BI, Microsoft Fabric enhances and expands its capabilities.
1.5 Why Microsoft Fabric Is Generating So Much Attention
The rapid growth of Microsoft Fabric adoption is driven by several factors. Organizations today are under increasing pressure to:
Traditional analytics environments often struggle to meet these demands because they rely on fragmented architectures. Microsoft Fabric addresses these challenges by providing:
For many organizations, Fabric represents an opportunity to modernize their analytics environment while reducing complexity.
To understand why Microsoft Fabric exists, it's important to understand the challenges facing modern analytics teams. Over the last decade, organizations have invested heavily in data and analytics technologies. While these investments have improved access to information, they have also created increasingly complex technology stacks.
A typical enterprise analytics architecture may include:
Each platform introduces its own:
As organizations scale, these complexities often become difficult to manage.
2.1 The Problem of Data Silos
One of the biggest challenges Microsoft Fabric aims to solve is data fragmentation. In many organizations:
Because these systems are disconnected, creating a complete view of business performance becomes difficult. Data silos can lead to:
Microsoft Fabric addresses this challenge through its unified architecture and centralized storage model.
2.2 Increasing Analytics Complexity
Analytics environments have become significantly more complicated over time. What once required a single reporting platform may now involve:
As complexity increases, so do operational costs and governance risks. Microsoft Fabric was designed to simplify this landscape by consolidating workloads into a single platform.
2.3 The Need for Faster Business Decisions
Organizations can no longer wait days or weeks for reports. Leaders increasingly require:
Microsoft Fabric helps organizations reduce the time between collecting data and taking action. By bringing data closer to decision-makers, Fabric enables faster and more informed business outcomes.
2.4 Supporting the Future of AI-Powered Analytics
Artificial intelligence is rapidly transforming how organizations use data. However, successful AI initiatives require:
Microsoft Fabric was built with AI in mind. Its architecture supports modern AI workloads while providing access to technologies such as Microsoft Copilot that help users interact with data more effectively. As organizations continue investing in AI-driven transformation, Microsoft Fabric provides the foundation needed to support future innovation.
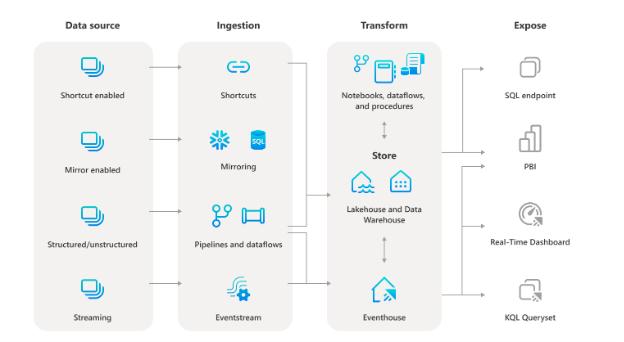
Microsoft Fabric works by bringing together the entire data and analytics lifecycle into a single unified platform. Instead of relying on separate tools for data integration, data engineering, storage, analytics, reporting, and governance, organizations can manage everything from one centralized environment.
Traditionally, businesses have built analytics ecosystems using multiple vendors and technologies. Data is often collected from various business systems, transferred through ETL tools, stored in separate data lakes and warehouses, transformed by engineering teams, and finally visualized in reporting platforms. While this approach can be effective, it often results in increased complexity, data duplication, governance challenges, and higher operational costs.
Microsoft Fabric simplifies this process by creating a connected analytics ecosystem where every workload operates on a shared data foundation. This allows organizations to move from raw data to actionable insights without constantly moving information between multiple platforms.
At the center of Microsoft Fabric is OneLake, a unified data lake that serves as the single source of truth for all analytics workloads. Data engineers, analysts, business users, executives, and data scientists can all work from the same underlying data, ensuring consistency across reports, dashboards, and analytical models.
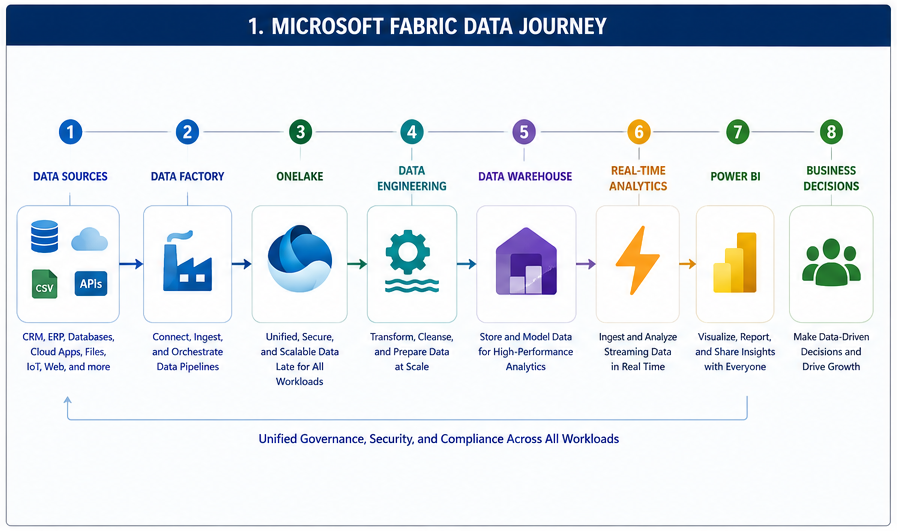
The Microsoft Fabric Data Journey
Every analytics workflow within Microsoft Fabric follows a structured process that transforms raw business data into actionable business intelligence.
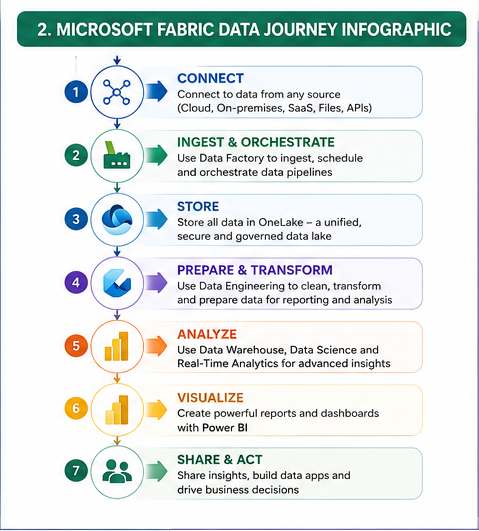
3.1 Step 1: Connect Data From Multiple Sources
The Microsoft Fabric journey begins by connecting data from various internal and external business systems. Most organizations generate data from dozens of platforms, including:
| Customer Relationship Management (CRM) | Marketing Platforms | Ecommerce Platforms |
|---|---|---|
| Salesforce | Google Analytics 4 | Shopify |
| HubSpot | Google Ads | Magento |
| Microsoft Dynamics 365 | LinkedIn Ads | WooCommerce |
| Zoho CRM | Meta Ads | BigCommerce |
| Marketing Automation Systems |
| Enterprise Applications | Databases | Other Sources |
|---|---|---|
| SAP | SQL Server | APIs |
| Oracle | PostgreSQL | Excel files |
| Microsoft Dynamics | LMySQL | CSV files |
| NetSuite | Snowflake | Cloud applications |
| Azure SQL | Internal systems |
One of the biggest challenges organizations face is that these systems often store data in different formats and structures. Microsoft Fabric provides a centralized framework for bringing all of this information together.
For example, a retail company may want to combine: Website traffic data, Customer purchase history, Inventory information, Marketing campaign performance, and Financial transactions into a single reporting environment. Microsoft Fabric makes this possible through its integrated architecture.
3.2 Step 2: Ingest and Orchestrate Data Using Data Factory
Once source systems are connected, Microsoft Fabric uses Data Factory to ingest and orchestrate data across the platform. Data Factory acts as the integration layer of Microsoft Fabric and enables organizations to automate data movement and transformation processes.
Key capabilities include:
Instead of manually exporting spreadsheets and uploading files, organizations can automate these workflows and ensure that analytics environments remain continuously updated. This reduces manual effort while improving reporting accuracy.
3.3 Step 3: Centralize Data Using OneLake
Once data enters Microsoft Fabric, it is stored within OneLake. OneLake is often described as the foundation of Microsoft Fabric because every workload within the platform can access and operate from the same centralized data repository.
In traditional analytics environments, organizations often maintain multiple copies of the same data across: Data warehouses, Data lakes, Reporting systems, and Department-specific databases.
This duplication creates: Governance issues, Storage inefficiencies, Data inconsistencies, and Reporting conflicts.
OneLake eliminates much of this complexity by creating a unified storage layer.
Benefits of OneLake
OneLake enables organizations to scale analytics while maintaining data consistency and governance.
3.4 Step 4: Transform and Prepare Data Through Data Engineering
Raw business data is rarely suitable for reporting immediately. Before analytics can occur, data often needs to be: Cleaned, Standardized, Merged, Enriched, and Validated.
Microsoft Fabric's Data Engineering workload provides the tools required to perform these tasks at scale. Built on Apache Spark technology, Data Engineering allows organizations to process large volumes of structured and unstructured data efficiently.
Typical activities include:
This stage is critical because poor data quality often leads to inaccurate reporting and poor business decisions.
3.5 Step 5: Organize Analytics Through the Data Warehouse
Once data has been prepared, organizations can store and manage it using Microsoft Fabric's Data Warehouse capabilities. The Data Warehouse serves as the analytical backbone of the platform.
It enables organizations to: Store large datasets, Run SQL queries, Create reporting models, Support business intelligence initiatives, and Deliver enterprise-grade analytics.
Unlike operational databases that focus on transactions, data warehouses are optimized for analytical workloads. This enables users to analyze historical trends, compare performance periods, monitor KPIs, and generate executive reporting at scale.
3.6 Step 6: Analyze Events Using Real-Time Analytics
Modern organizations increasingly require immediate visibility into business activity. Waiting for overnight reports is often no longer sufficient.
Microsoft Fabric's Real-Time Analytics capabilities allow businesses to process and analyze streaming data as it is generated.
Common use cases include:
By analyzing events in real time, organizations can respond more quickly to opportunities and challenges.
3.7 Step 7: Deliver Insights Through Power BI
Power BI is one of the most important components within Microsoft Fabric. Because Power BI is natively integrated into the Fabric ecosystem, users can build reports and dashboards directly on top of governed datasets.
Business users can:
The seamless connection between Power BI and Microsoft Fabric significantly reduces reporting complexity while improving accessibility to insights.
3.8 Step 8: Turn Insights Into Business Decisions
The ultimate purpose of Microsoft Fabric is not simply storing or visualizing data—it is enabling better decisions.
Once data has been transformed into actionable insights, organizations can: Improve operational efficiency, Increase revenue, Reduce costs, Optimize marketing performance, Improve customer experiences, Strengthen forecasting accuracy, and Enhance strategic planning.
By connecting every stage of the analytics lifecycle, Microsoft Fabric reduces the time between collecting data and taking action.
Why Microsoft's Unified Approach Matters
Traditional analytics stacks often require organizations to manage multiple vendors, platforms, integrations, and governance frameworks.
A typical analytics architecture may include: ETL tools, Data lakes, Data warehouses, Reporting platforms, Governance systems, and Machine learning environments. Each additional technology increases complexity, costs, and maintenance requirements.
Microsoft Fabric simplifies this architecture by providing:
This unified approach allows organizations to focus less on managing technology and more on generating business value from data.
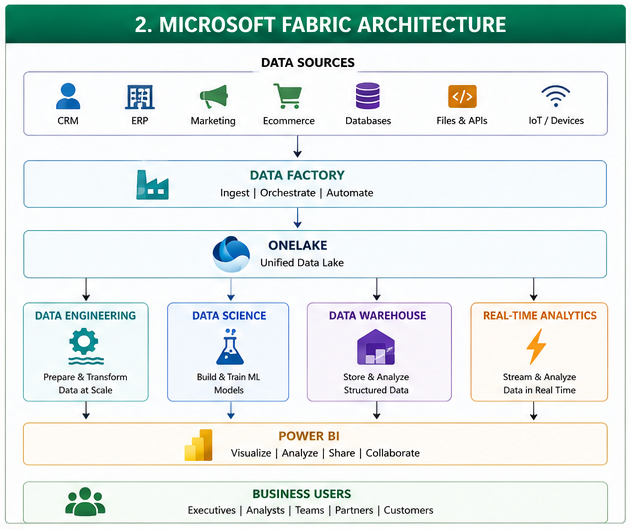
One of the primary reasons Microsoft Fabric has gained significant attention across the analytics industry is its ability to bring multiple analytics workloads together under a single platform. Instead of requiring separate products for data integration, engineering, storage, analytics, reporting, and artificial intelligence, Microsoft Fabric consolidates these capabilities into a unified ecosystem.
Each component within Microsoft Fabric serves a specific purpose while operating on a common data foundation through OneLake. This eliminates many of the challenges associated with traditional analytics environments where different teams often work with separate tools and disconnected datasets.
Understanding the core components of Microsoft Fabric is essential for organizations evaluating how the platform can support their data strategy, reporting requirements, and analytics initiatives.
4.1 OneLake – The Foundation of Microsoft Fabric
At the heart of Microsoft Fabric is OneLake, Microsoft's unified and centralized data lake. OneLake serves as the single source of truth for all workloads within Microsoft Fabric. Every component, whether Data Engineering, Data Science, Power BI, or Real-Time Analytics, operates from the same underlying storage layer.
Historically, organizations have maintained multiple copies of data across various platforms. Marketing teams might maintain one repository, finance another, and operations a separate data warehouse. This duplication often results in inconsistent reporting, governance challenges, and unnecessary storage costs.
OneLake addresses these issues by creating a centralized storage architecture where data can be stored once and utilized across multiple workloads.
Why OneLake Matters
Business Example
Imagine an ecommerce company storing: Shopify transaction data, Customer records, Marketing campaign performance, Inventory information, and Financial reporting data. Instead of maintaining separate repositories for each department, OneLake enables all stakeholders to access the same governed data foundation.
4.2 Data Factory – The Data Integration Engine
Before organizations can analyze data, they must first collect it. Microsoft Fabric Data Factory acts as the platform's data integration and orchestration layer.
Data Factory allows organizations to connect, ingest, move, transform, and schedule data from multiple business systems into Microsoft Fabric. Rather than manually exporting spreadsheets or building custom integrations, organizations can create automated pipelines that continuously deliver data into their analytics environment.
Core Functions of Data Factory
Organizations can connect Data Factory to: Salesforce, HubSpot, Dynamics 365, Google Analytics, Shopify, SQL Databases, APIs, Excel Files, Cloud Applications.
Business Value
Data Factory significantly reduces manual reporting processes while improving data consistency and reliability. Instead of spending hours consolidating spreadsheets, organizations can automate data collection and focus on generating insights.
4.3 Data Engineering – Transforming Raw Data Into Business Assets
Data is rarely analysis-ready when it enters an organization. Different systems often use different formats, structures, naming conventions, and business rules. Without proper preparation, reporting can become inconsistent and unreliable.
Microsoft Fabric's Data Engineering workload helps organizations prepare data for analytics and reporting. Built on Apache Spark, Data Engineering provides scalable tools for processing large datasets efficiently.
Common Data Engineering Activities
Why Data Engineering Is Important
The quality of analytics outputs depends heavily on the quality of the underlying data. Poor data quality often leads to: Inaccurate reports, Conflicting KPIs, Reduced trust in analytics, and Poor decision-making. Data Engineering ensures that organizations have a reliable foundation for reporting and analytics.
4.4 Data Science – Unlocking Predictive Insights
Modern organizations increasingly want to move beyond descriptive reporting and toward predictive decision-making. Microsoft Fabric includes integrated Data Science capabilities that enable teams to build machine learning models and advanced analytical solutions.
Data scientists can leverage Fabric to: Train predictive models, Analyze historical trends, Forecast future outcomes, Identify patterns, and Build AI-driven solutions.
Common Data Science Use Cases
By integrating Data Science directly into the analytics ecosystem, Microsoft Fabric enables organizations to move from historical reporting to forward-looking insights.
4.5 Data Warehouse – Enterprise Analytics at Scale
Microsoft Fabric includes a modern cloud-native Data Warehouse designed specifically for analytical workloads. A Data Warehouse differs from operational databases because it is optimized for reporting, analytics, and business intelligence.
Organizations use Data Warehouses to: Store historical data, Run complex analytical queries, Support executive reporting, Track business performance, and Enable enterprise analytics.
Key Benefits:
Common business applications include: Financial reporting, Operational dashboards, Executive scorecards, Performance management, and Historical trend analysis.
4.6 Real-Time Analytics – Insights as Events Happen
In today's business environment, waiting for daily or weekly reports is often no longer sufficient. Organizations increasingly need real-time visibility into operations.
Microsoft Fabric's Real-Time Analytics workload enables organizations to analyze streaming data as it is generated.
Typical Real-Time Analytics Use Cases
Benefits include the ability to respond faster to opportunities, detect operational issues earlier, improve customer experiences, reduce risks, and enhance decision-making speed.
4.7 Power BI – Visualization and Business Intelligence
Power BI remains one of the most recognizable and widely used components within Microsoft Fabric. While Fabric provides the data foundation, Power BI transforms that data into actionable insights through dashboards, reports, and visualizations.
Power BI allows organizations to: Build interactive dashboards, Create executive reports, Monitor KPIs, Share insights, and Enable self-service analytics.
Why Power BI Is Important Within Fabric
Unlike traditional architectures where reporting tools sit outside the data platform, Power BI is natively integrated into Microsoft Fabric. This provides:
Common dashboard types include: Executive Dashboards, Financial Dashboards, Marketing Dashboards, Sales Dashboards, Ecommerce Dashboards, and Operational Dashboards.
4.8 Data Activator – Turning Insights Into Actions
One of the newer components within Microsoft Fabric is Data Activator. Data Activator helps organizations move beyond reporting by automatically triggering actions when specific conditions occur.
Instead of simply displaying information, Data Activator enables organizations to respond automatically to business events. Examples:
This capability helps organizations become more proactive and responsive.
4.9 Copilot and AI-Powered Analytics
Artificial intelligence is becoming increasingly important within analytics environments. Microsoft Fabric incorporates AI capabilities through Microsoft Copilot, enabling users to interact with data using natural language.
Instead of writing complex queries, users can ask questions such as: "What were sales last quarter?", "Which products generated the highest revenue?", or "Show me top-performing marketing campaigns."
Copilot Capabilities
AI helps democratize analytics by making data more accessible to non-technical users. This enables organizations to increase adoption while accelerating decision-making.
One of the biggest advantages of Microsoft Fabric is its unified architecture. Unlike traditional analytics environments that require separate platforms for data storage, data integration, engineering, analytics, and reporting, Microsoft Fabric brings these capabilities together within a single ecosystem.
This architectural approach helps organizations reduce complexity, improve governance, eliminate data silos, and accelerate the delivery of business insights.
At a high level, Microsoft Fabric Architecture is built around three core principles:
These principles enable organizations to create scalable analytics ecosystems that support everything from operational reporting to advanced artificial intelligence initiatives.
Understanding the Microsoft Fabric Architecture
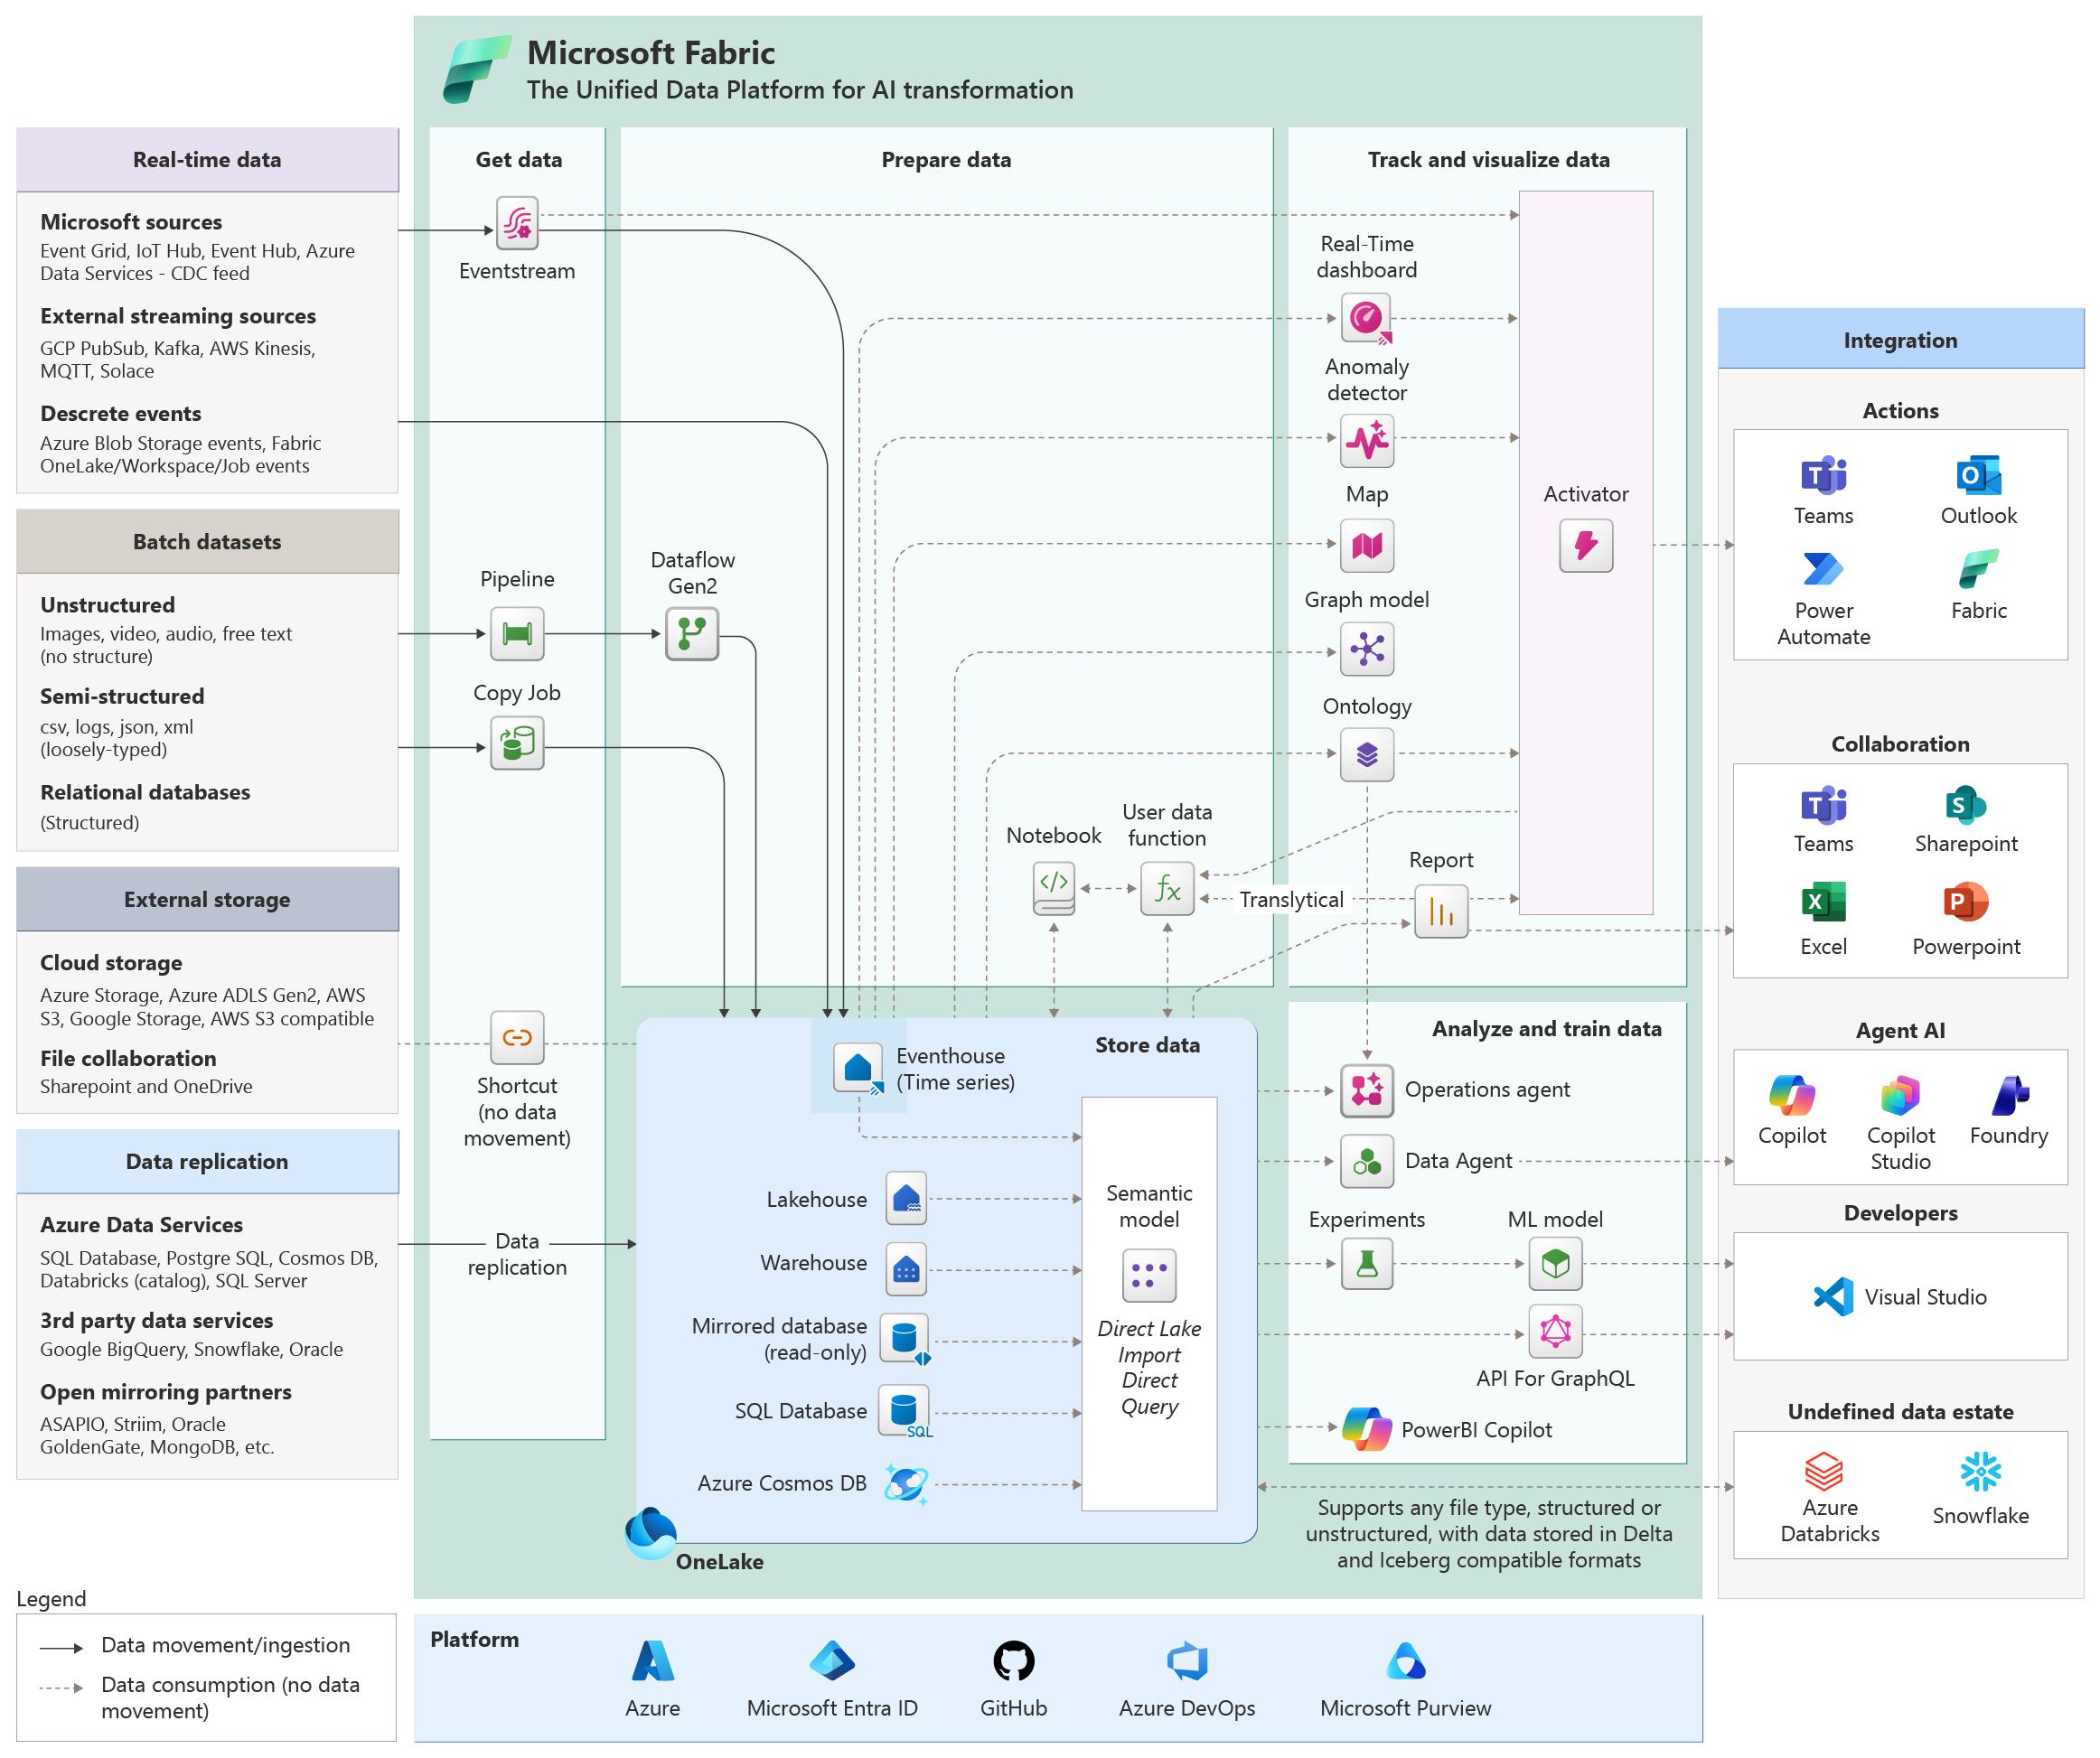
A typical Microsoft Fabric deployment consists of several interconnected layers that work together to transform raw data into business intelligence.
5.1 OneLake – The Architectural Foundation
At the center of Microsoft Fabric Architecture is OneLake. OneLake acts as the centralized storage layer for all Fabric workloads and serves as the single source of truth across the organization.
In traditional environments, different teams often maintain separate storage systems: Marketing data lake, Finance data warehouse, Operations database, Department-specific reporting systems. This often results in duplicated data, inconsistent reporting, and governance challenges.
OneLake addresses these problems by providing a unified storage architecture where data can be stored once and consumed by multiple workloads.
Benefits of OneLake Architecture
5.2 The Lakehouse Architecture in Microsoft Fabric
One of the most important architectural concepts within Microsoft Fabric is the Lakehouse. A Lakehouse combines the flexibility of a Data Lake with the performance and structure of a Data Warehouse.
Historically, organizations had to choose between:
Data Lakes
Data Warehouses
Benefits of Lakehouse Architecture
For organizations pursuing modern analytics strategies, Lakehouse architecture often becomes the foundation of enterprise reporting environments.
5.3 Workspace Architecture
Microsoft Fabric organizes workloads using Workspaces. Workspaces provide secure environments where teams can collaborate on analytics projects.
A Workspace may contain: Data pipelines, Lakehouses, Warehouses, Notebooks, Reports, Dashboards, and Semantic models.
5.4 Data Domains and Organizational Architecture
As analytics environments grow, governance becomes increasingly important. Microsoft Fabric introduces the concept of Domains to help organizations manage data ownership and accountability. A Domain represents a business area responsible for specific datasets and reporting assets.
Examples:
Domains help improve governance by clearly defining ownership and accountability.
5.5 Capacity Architecture
Microsoft Fabric operates on a capacity-based model. Instead of purchasing separate resources for every workload, organizations allocate Fabric capacity that can be shared across workloads.
This provides several advantages:
5.6 Security Architecture in Microsoft Fabric
Enterprise analytics environments require strong security controls. Microsoft Fabric incorporates security across multiple layers of the platform.
Identity and Access Management
Fabric integrates with Microsoft Entra ID (formerly Azure Active Directory). This enables organizations to manage: User authentication, Group permissions, Role-based access, and Single sign-on.
5.7 Governance Architecture
Data governance is often one of the most challenging aspects of enterprise analytics. Microsoft Fabric simplifies governance by providing centralized controls across workloads.
Governance capabilities include:
Strong governance ensures that analytics environments remain reliable, secure, and compliant.
5.8 Enterprise Deployment Architecture
Organizations can deploy Microsoft Fabric in various ways depending on their maturity and business requirements.
Most organizations begin with departmental deployments before expanding to enterprise-wide architectures.
5.9 Microsoft Fabric Architecture vs Traditional Analytics Architecture
The difference between traditional analytics environments and Microsoft Fabric becomes clear when comparing architectural complexity.
| Traditional Analytics Stack | Microsoft Fabric Architecture |
|---|---|
| Multiple Storage Systems | OneLake |
| Separate ETL Platform | Data Factory |
| Independent Warehouse | Fabric Warehouse |
| Separate BI Tool | Power BI |
| Multiple Security Models | Unified Governance |
| Complex Integrations | Native Connectivity |
| Multiple Vendors | Single Platform |
This simplification is one of the primary reasons organizations are evaluating Microsoft Fabric as a strategic analytics platform.
6.0 Why Microsoft Fabric Architecture Matters
Architecture decisions have long-term implications for scalability, governance, costs, and business agility.
Organizations that adopt fragmented architectures often struggle with: Increasing complexity, Rising costs, Data inconsistencies, Slow reporting cycles, and Governance challenges.
Microsoft Fabric addresses these issues through a unified architecture that brings together storage, integration, engineering, analytics, AI, and business intelligence into a single platform.
The result is an analytics ecosystem that is easier to manage, more scalable, and better aligned with modern data-driven business requirements.
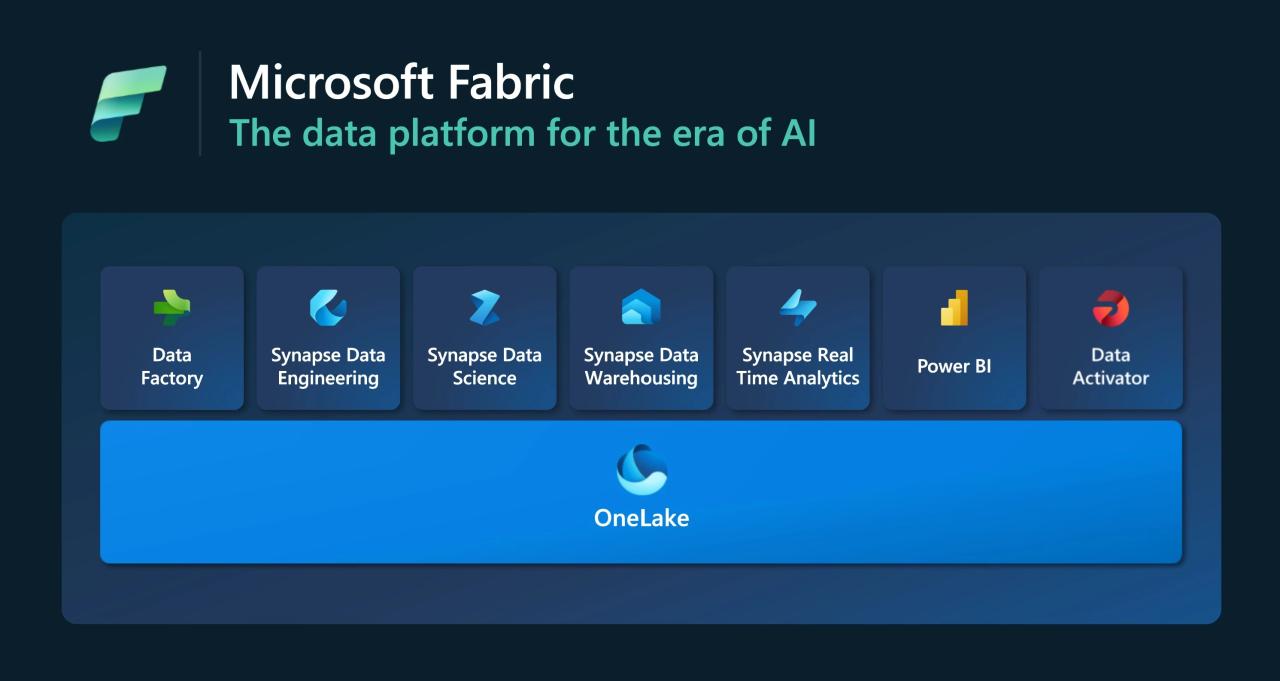
Microsoft Fabric is more than just another analytics platform. It represents a new approach to enterprise analytics by combining multiple technologies into a unified ecosystem that supports data integration, engineering, analytics, visualization, governance, and artificial intelligence.
What makes Microsoft Fabric particularly attractive to organizations is not simply the individual capabilities it offers, but the way these capabilities work together to simplify analytics operations while improving scalability, performance, and business agility.
Understanding the key features of Microsoft Fabric helps organizations evaluate how the platform can support modern reporting, data management, and business intelligence initiatives.
6.1 Unified Analytics Platform
One of the most significant features of Microsoft Fabric is its ability to bring together multiple analytics workloads within a single platform. Traditionally, organizations have relied on separate tools for Data Integration, Data Engineering, Data Warehousing, Data Science, Business Intelligence, Real-Time Analytics, and Governance.
Managing these systems independently often leads to increased complexity, higher costs, and inconsistent reporting. Microsoft Fabric consolidates these workloads into a unified environment where data professionals, business users, analysts, and executives can collaborate more effectively.
Benefits of a Unified Analytics Platform
6.2 OneLake – A Single Source of Truth
OneLake is one of the most important innovations within Microsoft Fabric. Rather than maintaining multiple storage systems, OneLake provides a centralized repository that serves all Fabric workloads. This allows organizations to establish a true single source of truth for reporting and analytics.
Key Advantages of OneLake
For many organizations, OneLake becomes the foundation of their modern data strategy.
6.3 Native Power BI Integration
Power BI is fully integrated into Microsoft Fabric, creating a seamless experience between data management and business intelligence. Unlike traditional architectures where reporting tools are separated from storage and analytics platforms, Fabric enables Power BI to operate directly on governed datasets.
Benefits of Native Integration
6.4 SaaS-First Architecture
Microsoft Fabric is delivered entirely as a Software-as-a-Service (SaaS) platform. Organizations do not need to manage: Servers, Infrastructure, Software Updates, Platform Maintenance, or Capacity Provisioning.
Microsoft handles the underlying infrastructure, allowing organizations to focus on generating business value from data.
Advantages of SaaS Architecture
6.4 Built-In Data Engineering Capabilities
Microsoft Fabric includes powerful Data Engineering functionality designed to prepare data for analytics and reporting. Using Apache Spark technology, organizations can process large-scale datasets efficiently.
Data Engineering Features
6.5 Enterprise Data Warehousing
Microsoft Fabric includes a modern cloud-based Data Warehouse optimized for analytical workloads.
Key Benefits:
The Data Warehouse provides the foundation for many enterprise reporting initiatives.
6.6 Real-Time Analytics
Businesses increasingly require immediate access to information. Microsoft Fabric supports Real-Time Analytics, allowing organizations to analyze streaming data as events occur.
Common Use Cases:
Business Benefits: Faster decision-making, Improved responsiveness, Enhanced operational visibility, and Better customer experiences. Real-Time Analytics enables organizations to move from reactive reporting to proactive decision-making.
6.7 AI-Powered Analytics with Copilot
Artificial Intelligence is becoming increasingly important in modern analytics environments. Microsoft Fabric incorporates AI capabilities through Microsoft Copilot, helping users interact with data using natural language.
Copilot Features
AI-powered analytics helps organizations increase adoption and improve decision-making speed.
6.8 Open Data Formats and Interoperability
Microsoft Fabric is built around open standards, allowing organizations to avoid vendor lock-in while maintaining flexibility.
Benefits
6.9 Enterprise Security and Governance
Security and governance are critical considerations for any analytics platform. Microsoft Fabric incorporates governance capabilities throughout the platform.
Governance Features
6.10 Data Activator and Automated Actions
Traditional reporting platforms often stop at delivering insights. Microsoft Fabric goes further through Data Activator. A Data Activator allows organizations to trigger actions automatically when specific conditions occur.
Examples:
6.11 Scalability and Performance
Microsoft Fabric is designed to support organizations ranging from small businesses to large global enterprises. As data volumes grow, Fabric can scale to accommodate: More users, Larger datasets, Additional workloads, Increased reporting requirements, and Advanced AI initiatives.
Scalability Benefits
6.12 Why These Features Matter
Individually, each Microsoft Fabric feature provides value. Together, they create a unified analytics platform that addresses many of the challenges organizations face with traditional data architectures.
By combining OneLake, Data Factory, Data Engineering, Data Warehouse, Real-Time Analytics, Power BI, Data Activator, and Copilot, Microsoft Fabric enables organizations to simplify analytics operations, improve governance, reduce costs, and accelerate the delivery of business insights. For businesses pursuing data-driven transformation, these features provide the foundation for a modern, scalable, and future-ready analytics ecosystem.
As organizations continue to invest in data-driven decision-making, they are increasingly looking for platforms that can simplify analytics operations while delivering measurable business value. Microsoft Fabric was designed with this objective in mind.
Beyond its technical capabilities, Microsoft Fabric provides a wide range of strategic, operational, and financial benefits that help organizations modernize their analytics ecosystems, improve governance, and accelerate business outcomes.
7.1 Simplifies Complex Analytics Ecosystems
One of the most immediate benefits of Microsoft Fabric is its ability to simplify analytics architecture. Many organizations currently operate fragmented environments that include Data Integration Platforms, Data Lakes, Data Warehouses, Business Intelligence Tools, Governance Solutions, Data Science Platforms, and Streaming Analytics Systems.
Microsoft Fabric consolidates these workloads into a single platform, reducing the number of systems organizations need to deploy, manage, secure, and maintain.
Business Impact:
7.2 Creates a Single Source of Truth
One of the biggest challenges organizations face is maintaining consistent data across departments. Marketing teams may report different revenue numbers than finance teams. Sales reports may not align with executive dashboards.
By creating a single source of truth, organizations can ensure that: Reports are consistent, KPIs are standardized, Business definitions remain aligned, Data quality improves, and Decision-makers trust analytics outputs.
7.3 Accelerates Time-to-Insight
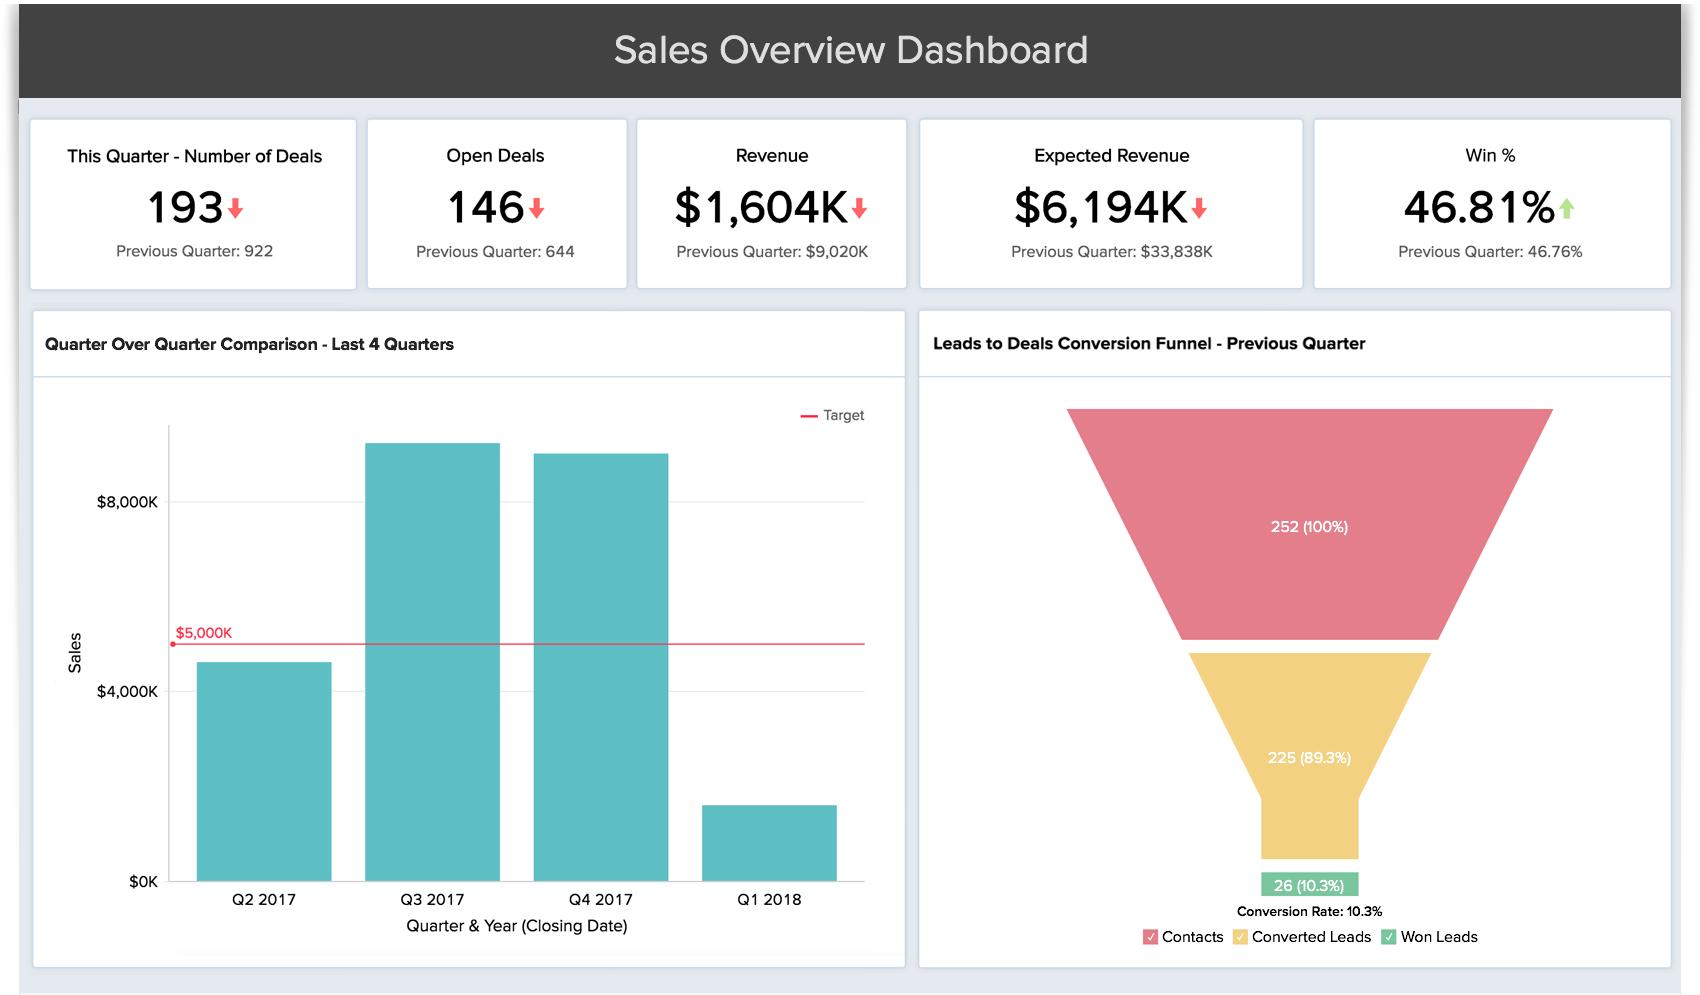
Traditional analytics environments often involve lengthy data preparation, movement, and reporting processes. By integrating data ingestion, engineering, warehousing, analytics, and visualization into one platform, Microsoft Fabric significantly reduces the time required to move from raw data to actionable insights.
Benefits Include:
7.4 Reduces Infrastructure and Operational Costs
Many organizations spend significant resources maintaining analytics infrastructure. These costs often include licensing multiple platforms, managing storage environments, maintaining integrations, supporting infrastructure, and monitoring security.
Microsoft Fabric helps reduce these expenses by consolidating workloads into a unified platform. Cost reduction opportunities include: Fewer Platforms, Lower Administrative Overhead, Shared Capacity Model, and Reduced Integration Costs.
7.5 Improves Data Governance and Security
As organizations grow, maintaining governance becomes increasingly important. Poor governance can lead to data inconsistencies, security vulnerabilities, compliance risks, and reduced trust in analytics.
Governance Benefits:
7.6 Enhances Collaboration Across Teams
Analytics initiatives often involve multiple stakeholders. Traditional environments often create barriers between these groups because each team works within separate systems. Microsoft Fabric helps eliminate these silos by providing a shared analytics ecosystem.
Collaboration Benefits:
7.7 Supports Enterprise-Scale Analytics
As organizations grow, analytics environments must scale accordingly. Microsoft Fabric is designed to support: Large datasets, High user volumes, Complex reporting requirements, Enterprise governance standards, and Global deployments.
Scalability Advantages:
7.8 Enables Real-Time Business Intelligence
Many organizations still rely on daily, weekly, or monthly reporting cycles. However, modern business environments often require immediate access to information. Microsoft Fabric's Real-Time Analytics capabilities enable organizations to monitor Customer behavior, Transactions, Marketing performance, Operational metrics, and Financial activities as events occur.
Business Benefits:
7.8_b Democratizes Access to Analytics
Historically, analytics has often been limited to technical teams. Business users frequently depended on analysts or IT departments to generate reports and answer questions. Microsoft Fabric helps democratize analytics through Power BI, Self-Service Reporting, Natural Language Queries, AI-Powered Insights, and Copilot.
Benefits for Business Users
7.9 Accelerates AI and Advanced Analytics Initiatives
Artificial Intelligence is becoming a strategic priority for many organizations. However, successful AI initiatives require High-quality data, Scalable infrastructure, Strong governance, and Unified analytics environments. Microsoft Fabric provides the foundation necessary to support AI adoption.
AI Benefits:
7.10 Benefits for Executives
Executives benefit from: Faster access to business insights, Consistent enterprise reporting, Improved strategic visibility, Better forecasting capabilities, and Enhanced decision-making confidence.
With Microsoft Fabric, leadership teams gain a more complete and accurate view of organizational performance.
7.11 Benefits for IT and Data Teams
IT and data teams benefit from: Reduced infrastructure complexity, Simplified governance, Centralized security, Improved scalability, and Lower maintenance overhead.
This allows technical teams to focus on innovation rather than platform administration.
7.12 Benefits for Analysts and Business Users
Analysts and business users gain: Faster access to data, Improved reporting capabilities, Self-service analytics, Better collaboration, and Reduced reliance on manual processes.
These benefits improve productivity and increase the overall value organizations derive from analytics investments.
Why These Benefits Matter
The true value of Microsoft Fabric lies in its ability to combine technical capabilities with tangible business outcomes. By simplifying analytics environments, improving governance, reducing costs, enabling real-time intelligence, and supporting AI-driven innovation, Microsoft Fabric helps organizations create a more agile, scalable, and data-driven future.
For businesses seeking to modernize their analytics ecosystems, the benefits of Microsoft Fabric extend far beyond technology—they directly impact decision-making, operational efficiency, and long-term competitive advantage.
While understanding the architecture and features of Microsoft Fabric is important, the real value of the platform becomes evident when examining how organizations use it to solve business challenges.
Microsoft Fabric is designed to support a wide range of analytics, reporting, data management, and business intelligence initiatives across industries. Because the platform combines data integration, engineering, warehousing, analytics, AI, and visualization capabilities, organizations can use it to support everything from executive reporting to real-time operational monitoring.
8.1 Executive Reporting and Business Performance Management
One of the most common Microsoft Fabric use cases is executive reporting. Senior leadership teams require a consolidated view of organizational performance across departments, business units, and geographic regions. Microsoft Fabric enables organizations to centralize executive reporting by combining data from CRM systems, ERP platforms, Financial systems, Marketing tools, Operational databases, and Ecommerce platforms into a single reporting environment.
Common Executive Reporting Metrics
Executives gain Real-time visibility, Faster decision-making, Improved forecasting, Consistent KPI tracking, and Better organizational alignment.
8.2 Marketing Analytics and Campaign Performance Tracking
Marketing teams often manage data across multiple channels and platforms. Without a centralized analytics platform, measuring marketing performance can become extremely challenging. Microsoft Fabric enables organizations to consolidate marketing data and create unified reporting environments.
Key Marketing Analytics Use Cases
Marketing teams can Improve campaign performance, Reduce acquisition costs, Increase conversion rates, Optimize channel investments, and Enhance customer targeting.
8.3 Sales Analytics and Pipeline Management
Sales teams depend on accurate, timely information to manage pipelines, forecast revenue, and improve performance. Microsoft Fabric enables organizations to consolidate sales data from CRM systems and operational platforms to create comprehensive sales analytics solutions.
Common Sales Use Cases
Organizations can Improve forecasting accuracy, Increase sales productivity, Identify growth opportunities, Optimize resource allocation, and Improve pipeline visibility.
8.4 Customer Analytics and Customer 360 Reporting
Customer data often exists across multiple systems. These may include CRM platforms, Ecommerce systems, Marketing platforms, Customer support tools, and Loyalty programs. Microsoft Fabric helps organizations create a unified Customer 360 view by consolidating data across these touchpoints.
Customer Analytics Use Cases
Organizations can Improve retention, Increase customer satisfaction, Personalize marketing efforts, Enhance customer experiences, and Maximize customer lifetime value.
8.5 Financial Reporting and Business Planning
Finance departments require accurate and consistent reporting to support budgeting, forecasting, and strategic planning. Microsoft Fabric enables organizations to centralize financial data while improving reporting efficiency.
Financial Analytics Use Cases
Finance teams gain Faster reporting cycles, Improved forecast accuracy, Better financial visibility, Enhanced planning capabilities, and Stronger governance.
8.6 Ecommerce Analytics and Digital Commerce Reporting
Ecommerce organizations generate large volumes of customer, product, marketing, and transaction data. Microsoft Fabric helps centralize these datasets into a unified analytics ecosystem.
Ecommerce Analytics Use Cases
Ecommerce organizations can Improve conversion rates, Increase average order value, Reduce customer acquisition costs, Optimize inventory planning, and Improve profitability.
8.7 Supply Chain and Operations Analytics
Organizations increasingly rely on real-time visibility into operational performance. Microsoft Fabric enables supply chain teams to monitor data across procurement, inventory, logistics, and production systems.
Supply Chain Use Cases
Organizations can Reduce operational costs, Improve inventory management, Minimize stockouts, Improve service levels, and Enhance supply chain visibility.
8.8 Manufacturing Analytics
Manufacturing organizations generate operational data from equipment, production lines, sensors, and enterprise systems. Microsoft Fabric helps transform this information into actionable insights.
Manufacturing Use Cases
Manufacturers can Improve productivity, Reduce downtime, Enhance quality, Optimize operations, and Increase profitability.
8.9 Healthcare Analytics and Reporting
Healthcare organizations manage vast amounts of clinical, operational, and financial data. Microsoft Fabric enables healthcare providers to centralize reporting while improving operational visibility.
Healthcare Use Cases
Healthcare organizations can Improve patient care, Increase operational efficiency, Reduce costs, Enhance resource planning, and Improve compliance.
8.10 Real-Time Analytics and Operational Intelligence
Many organizations require immediate visibility into business activity. Microsoft Fabric's Real-Time Analytics capabilities enable businesses to analyze streaming data as events occur.
Real-Time Use Cases:
Organizations can Respond faster, Improve customer experiences, Reduce operational risk, Increase agility, and Enable proactive decision-making.
8.11 AI and Predictive Analytics
One of the most exciting Microsoft Fabric use cases involves Artificial Intelligence and predictive analytics. Organizations can leverage Fabric's Data Science and AI capabilities to move beyond historical reporting and predict future outcomes.
AI Use Cases
Organizations can Improve forecasting accuracy, Reduce risks, Increase efficiency, Enhance customer experiences, and Support strategic planning.
Why Microsoft Fabric Supports Such Diverse Use Cases
Unlike traditional analytics platforms that focus on a single capability, Microsoft Fabric combines Data Integration, Data Engineering, Data Warehousing, Real-Time Analytics, Business Intelligence, and AI and Machine Learning within a unified ecosystem.
This allows organizations to support a wide variety of business use cases without building separate technology stacks for each initiative. Whether the goal is executive reporting, customer analytics, operational intelligence, or AI-driven forecasting, Microsoft Fabric provides a scalable foundation for transforming data into business value.
For many organizations, the decision to adopt Microsoft Fabric is not simply about implementing a new technology platform—it's about simplifying an increasingly complex analytics ecosystem.
Over the past decade, businesses have invested heavily in analytics technologies to support reporting, data integration, business intelligence, data science, and artificial intelligence initiatives. While these investments have delivered value, they have also created fragmented environments that require multiple tools, vendors, integrations, and governance frameworks.
Microsoft Fabric was designed to address these challenges by providing a unified analytics platform that combines multiple workloads into a single ecosystem.
To understand the value of Microsoft Fabric, it's important to compare it with traditional analytics architectures and evaluate how the two approaches differ in terms of complexity, scalability, governance, cost, and business impact.
9.1 What Is a Traditional Analytics Architecture?
Before platforms like Microsoft Fabric emerged, organizations typically built analytics environments using multiple specialized tools.
Each layer serves a valuable purpose, but collectively they create a complex environment that requires significant effort to maintain.
9.2 The Challenges of Traditional Analytics Platforms
While traditional architectures are capable of supporting enterprise reporting and analytics, they often introduce challenges that become more difficult to manage as organizations scale.
As a result, many organizations spend substantial time managing analytics platforms rather than generating business insights.
9.3 How Microsoft Fabric Changes the Model
Microsoft Fabric takes a fundamentally different approach. Instead of assembling multiple technologies, Fabric provides a unified analytics platform where major workloads operate on a shared foundation.
This includes: Data Integration, Data Engineering, Data Science, Data Warehouse, Real-Time Analytics, Business Intelligence, and AI-Powered Analytics. Because these workloads are integrated within the same ecosystem, organizations can reduce complexity while improving consistency and governance.
9.4 Architecture Comparison
| Traditional Analytics Architecture Challenges | Microsoft Fabric Architecture Benefits |
|---|---|
| Multiple vendors | Unified platform |
| Multiple security models | Centralized governance |
| Separate storage systems | Shared storage |
| Increased maintenance | Integrated analytics |
| Higher governance complexity | Simplified administration |
9.5 Microsoft Fabric vs Traditional Analytics Platforms Comparison
| Capability | Traditional Analytics Stack | Microsoft Fabric |
|---|---|---|
| Data Integration | Separate ETL Tool | Built-In |
| Data Storage | Separate Data Lake | OneLake |
| Data Warehouse | Separate Platform | Integrated |
| BI & Reporting | Separate Tool | Native Power BI |
| Real-Time Analytics | Additional Product | Included |
| AI & Copilot | Often Separate | Integrated |
| Governance | Distributed | Centralized |
| Security | Multiple Layers | Unified |
| Infrastructure Management | High | Reduced |
| Vendor Management | Multiple Vendors | Single Ecosystem |
| Scalability | Complex | Simplified |
| Time-to-Insight | Slower | Faster |
9.6 Data Management Comparison
Data management is often one of the biggest differentiators between traditional analytics environments and Microsoft Fabric.
Traditional Approach: Organizations frequently store data across Data Lakes, Warehouses, Department Databases, and Reporting Systems. This can result in Duplicate data, Storage inefficiencies, and Governance challenges.
Microsoft Fabric Approach: OneLake serves as a centralized repository. Benefits include a Single source of truth, Reduced duplication, Better governance, Improved collaboration, and Simplified architecture. This creates a more scalable and manageable analytics environment.
9.7 Governance and Security Comparison
Strong governance is essential for modern analytics initiatives.
Traditional Platforms: Governance often requires Multiple permission models, Separate security tools, and Independent compliance processes. This can create operational complexity and increase risk.
Microsoft Fabric: Governance is integrated throughout the platform. Capabilities include Role-based access control, Workspace permissions, Row-level security, Data lineage, and Centralized administration. This helps organizations maintain consistency while reducing governance overhead.
9.8 AI Readiness Comparison
Artificial Intelligence is rapidly becoming a strategic priority for organizations across industries. However, successful AI initiatives require Trusted data, Scalable infrastructure, Centralized governance, and Accessible analytics environments.
Traditional Architectures: Organizations often need separate AI platforms and machine learning environments. This introduces additional complexity.
Microsoft Fabric: AI capabilities are integrated directly into the platform through Data Science Workloads, Copilot, Advanced Analytics, and Predictive Modeling. This reduces barriers to AI adoption and accelerates innovation.
9.9 Cost Considerations
Cost is often a major factor when evaluating analytics platforms.
Traditional Analytics Environments: Organizations may incur costs for Multiple software licenses, Separate infrastructure, Integration development, Ongoing maintenance, and Governance tooling. As complexity increases, costs often grow accordingly.
Microsoft Fabric: By consolidating workloads into a unified platform, organizations can potentially reduce Licensing overhead, Infrastructure complexity, Administrative effort, and Integration costs. The exact financial impact depends on organizational requirements, but many businesses view consolidation as a significant opportunity for optimization.
9.10 Which Organizations Benefit Most From Microsoft Fabric?
Microsoft Fabric is particularly valuable for organizations that:
Fabric integrates naturally with Power BI, Azure, Dynamics 365, and Microsoft 365. Organizations already using Microsoft technologies can often achieve value more quickly due to existing ecosystem alignment.
9.11 When a Traditional Analytics Architecture May Still Be Appropriate
While Microsoft Fabric offers significant advantages, some organizations may continue using traditional architectures. Examples include:
However, even in these situations, many organizations are evaluating how Microsoft Fabric can complement or gradually replace existing architectures.
9.12 Why More Organizations Are Evaluating Microsoft Fabric
The growing interest in Microsoft Fabric reflects a broader shift within the analytics industry. Organizations are increasingly seeking Simpler architectures, Better governance, Faster time-to-insight, AI readiness, and Reduced operational complexity.
Microsoft Fabric addresses these priorities by providing a unified analytics platform that combines data integration, engineering, warehousing, reporting, and AI into a single ecosystem. For organizations looking to modernize their analytics strategy, Microsoft Fabric offers a compelling alternative to traditional multi-platform architectures.
One of the most common questions organizations ask when evaluating Microsoft's analytics ecosystem is whether Microsoft Fabric and Power BI are competing solutions or complementary technologies.
The short answer is that Power BI is a key component within Microsoft Fabric, not a replacement or competitor. While Power BI focuses primarily on data visualization, reporting, and business intelligence, Microsoft Fabric extends far beyond reporting by providing a complete end-to-end analytics platform.
Organizations that understand this distinction are better positioned to make informed decisions about their data strategy, analytics investments, and long-term digital transformation initiatives.
10.1 What Is Power BI?
Power BI is Microsoft's business intelligence and data visualization platform that enables organizations to transform data into interactive dashboards, reports, and visual analytics.
Power BI helps business users:
For many organizations, Power BI serves as the final layer of the analytics process where business users consume information and make decisions.
10.2 What Is Microsoft Fabric?
Microsoft Fabric is a unified analytics platform that combines multiple workloads into a single environment, including: OneLake, Data Factory, Data Engineering, Data Science, Data Warehouse, Real-Time Analytics, Power BI, and Copilot and AI Capabilities.
Rather than focusing solely on reporting, Microsoft Fabric supports the entire data lifecycle—from data ingestion and transformation to analytics and visualization.
10.3 Microsoft Fabric vs Power BI Comparison
| Capability | Power BI | Microsoft Fabric |
|---|---|---|
| Dashboards & Reports | ✓ | ✓ |
| Data Visualization | ✓ | ✓ |
| KPI Monitoring | ✓ | ✓ |
| Self-Service Analytics | ✓ | ✓ |
| Data Integration | Limited | ✓ |
| Data Engineering | ✗ | ✓ |
| Data Warehouse | ✗ | ✓ |
| Real-Time Analytics | Limited | ✓ |
| AI & Machine Learning | Limited | ✓ |
| OneLake Storage | ✗ | ✓ |
| End-to-End Analytics | ✗ | ✓ |
10.4 When Power BI Is Enough
Power BI may be sufficient when: Reporting requirements are straightforward, Data volumes are relatively small, Existing data infrastructure already exists, or Organizations primarily need dashboards and reporting.
For example, a company connecting data from Excel, Google Analytics, and a CRM system may find that Power BI adequately meets its reporting needs.
10.5 When Microsoft Fabric Makes Sense
Microsoft Fabric becomes increasingly valuable when organizations need: Enterprise-scale analytics, Centralized data management, Advanced data engineering, Real-time analytics, AI-driven insights, Cross-functional reporting environments, and Strong governance and security.
Organizations looking to modernize their analytics architecture often adopt Microsoft Fabric while continuing to leverage Power BI for reporting and visualization.
Power BI and Microsoft Fabric are not competing products. Power BI helps organizations visualize and consume data, while Microsoft Fabric provides the underlying analytics foundation that powers modern data-driven organizations. For many businesses, the future is not choosing between Power BI or Fabric—it is leveraging both together as part of a unified analytics strategy.
As organizations continue to generate increasing volumes of data, the ability to transform information into actionable insights has become a critical competitive advantage. Traditional analytics architectures often rely on multiple tools, disconnected systems, and complex integrations that can create operational challenges, increase costs, and slow decision-making.
Microsoft Fabric addresses these challenges by bringing together data integration, engineering, warehousing, analytics, business intelligence, and AI into a unified platform. Through capabilities such as OneLake, Data Factory, Real-Time Analytics, Data Science, and native Power BI integration, organizations can simplify their analytics ecosystems while creating a scalable foundation for future growth.
Whether your goal is to centralize reporting, improve governance, enable self-service analytics, support AI initiatives, or modernize enterprise data infrastructure, Microsoft Fabric provides the tools and flexibility needed to support a data-driven organization.
As adoption continues to accelerate across industries, Microsoft Fabric is increasingly becoming the platform of choice for organizations seeking to unify analytics, improve decision-making, and unlock greater value from their data investments.
Microsoft Fabric is Microsoft's unified analytics platform that combines data integration, data engineering, data warehousing, business intelligence, real-time analytics, and AI capabilities into a single cloud-based environment.
No. Microsoft Fabric is not replacing Power BI. Instead, Power BI is a core component within Microsoft Fabric and continues to serve as Microsoft's primary business intelligence and data visualization platform.
OneLake is the centralized storage layer within Microsoft Fabric. It acts as a single source of truth where all analytics workloads can access and work from the same governed data foundation.
Organizations use Microsoft Fabric for:
Yes. Microsoft Fabric is delivered as a Software-as-a-Service (SaaS) platform, eliminating the need for organizations to manage infrastructure, servers, or platform maintenance.