Dashboard Title
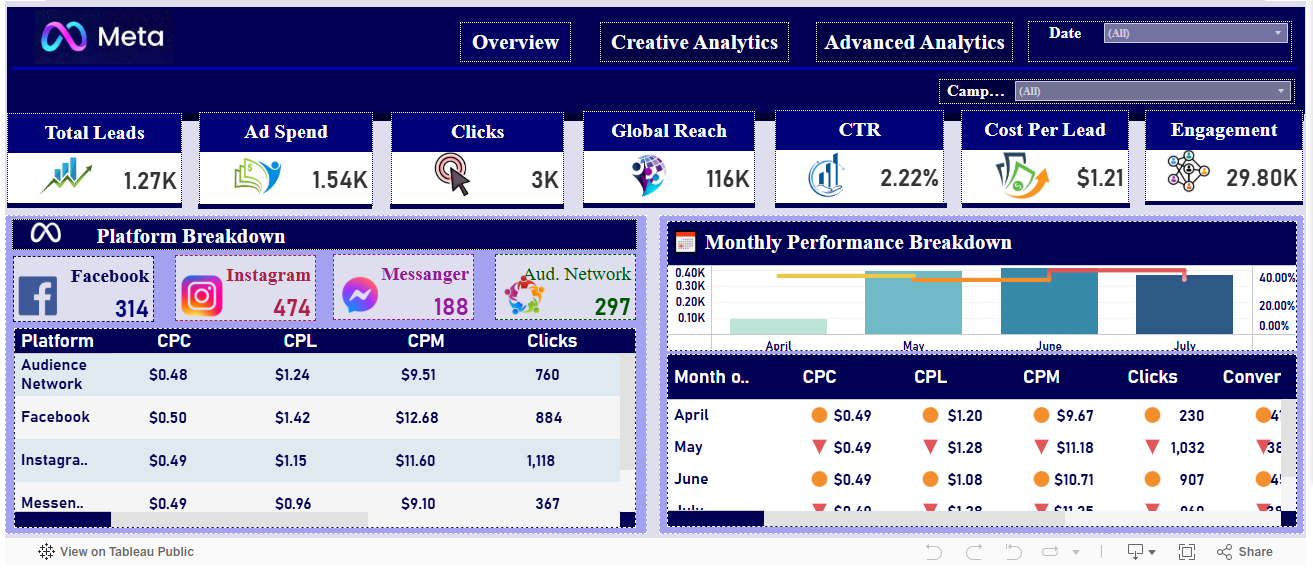
The Tableau Meta Ads Data Dashboard provides a centralized view of Facebook and Instagram advertising performance through interactive and visually rich analytics.
Image
Description
The Tableau Meta Ads Data Dashboard provides a centralized view of Facebook and Instagram advertising performance through interactive and visually rich analytics. Designed for marketers, agencies, and business leaders, it enables users to monitor key metrics such as impressions, reach, clicks, click-through rate (CTR), conversions, conversion rate, advertising spend, cost per click (CPC), cost per acquisition (CPA), and return on ad spend (ROAS). Interactive visualizations help analyze campaign performance by account, campaign, ad set, audience, creative, placement, device, and reporting period. Dynamic filters and drill-down capabilities make it easy to identify trends, optimize ad performance, and improve marketing ROI. Built with Tableau, the dashboard supports automated data connectivity and responsive visualizations, reducing manual reporting efforts. By consolidating Meta Ads data into a single analytics platform, the dashboard enables organizations to evaluate campaign effectiveness, optimize advertising strategies, and make faster, data-driven marketing decisions.
Sign in to unlock full template details
Features, requirements, and implementation details are visible only to signed-in users.
Key Features
Demo Link
Demo video/link will be available soon.
Software Requirements
Additional Considerations
One-time purchase
What You'll Receive
Dashboard Package
Implementation Services
Optional Customization