Dashboard Title
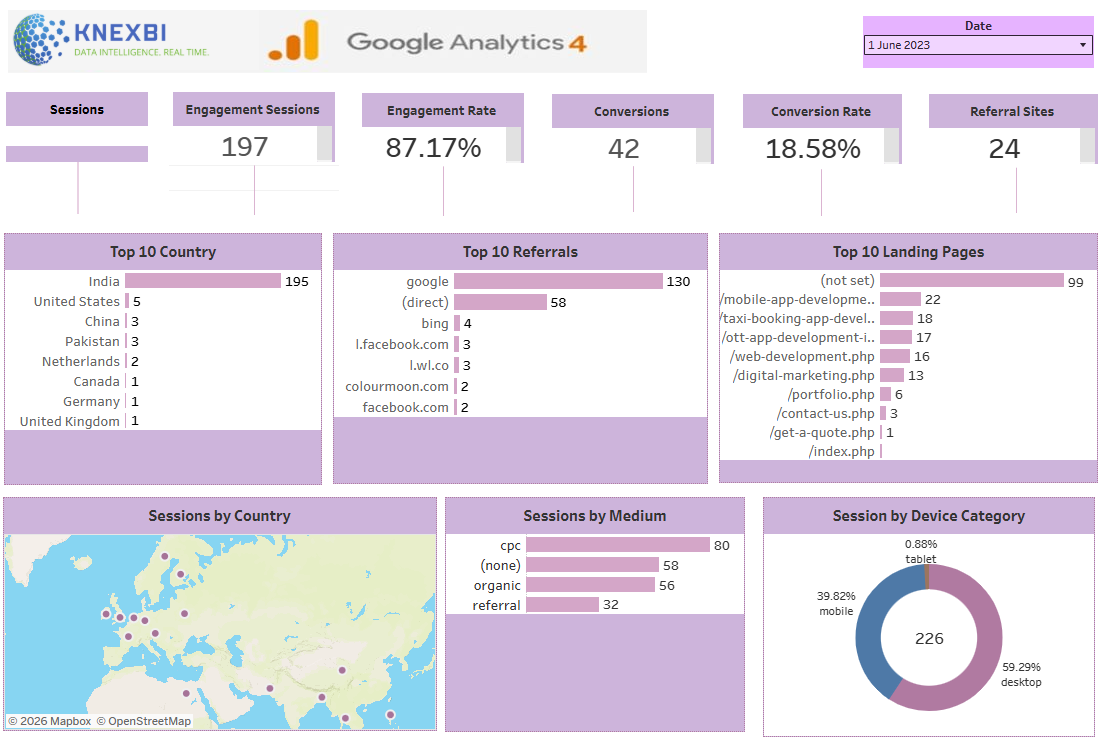
The Tableau GA4 Overview Report provides a comprehensive view of website performance by transforming Google Analytics 4 (GA4) data into interactive visual analytics.
Image
Description
The Tableau GA4 Overview Report provides a comprehensive view of website performance by transforming Google Analytics 4 (GA4) data into interactive visual analytics. Designed for marketers, analysts, and business leaders, it enables users to monitor key metrics such as users, new users, sessions, engaged sessions, engagement rate, average engagement time, event count, conversions, and revenue from a single dashboard. Interactive visualizations help analyze traffic sources, landing pages, user behavior, devices, geographic locations, and marketing channel performance. Dynamic filters and drill-down capabilities allow users to explore data by date range, acquisition channel, device type, country, and campaign for deeper insights. Built with Tableau, the report delivers responsive visualizations and automated data connectivity that simplify website performance monitoring. By consolidating GA4 metrics into one analytics platform, the dashboard helps organizations optimize digital marketing strategies, improve user engagement, measure campaign effectiveness, and make faster, data-driven business decisions.
Sign in to unlock full template details
Features, requirements, and implementation details are visible only to signed-in users.
Key Features
Demo Link
Demo video/link will be available soon.
Software Requirements
Additional Considerations
One-time purchase
What You'll Receive
Dashboard Package
Implementation Services
Optional Customization