Dashboard Title
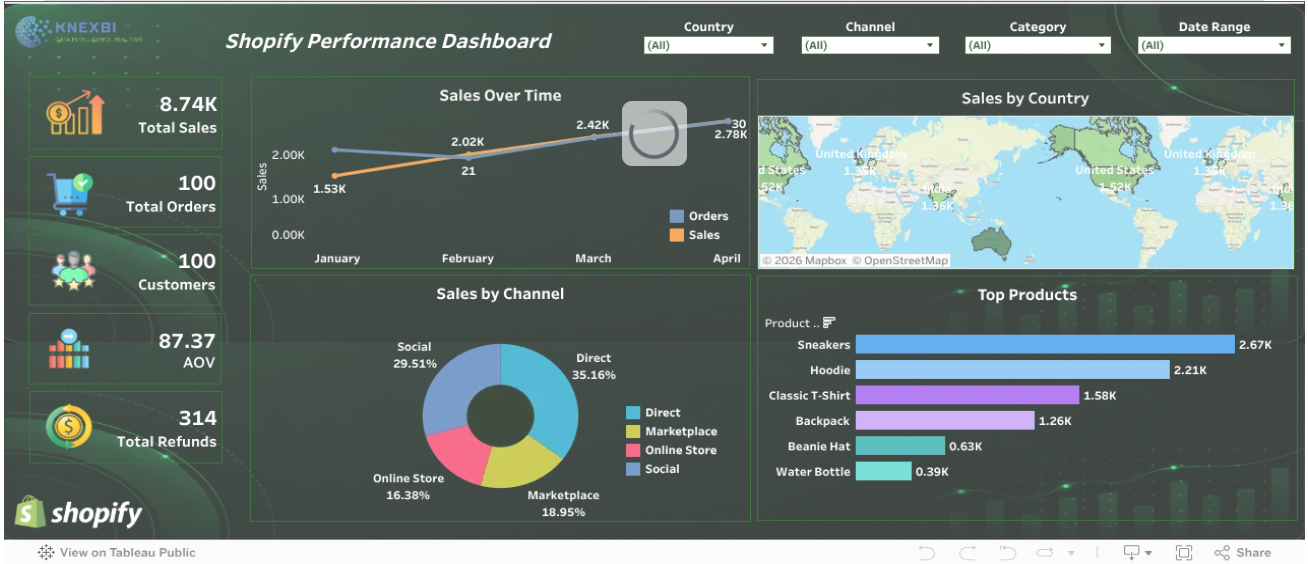
The Tableau Shopify Performance Dashboard V1 provides a centralized view of your Shopify store's performance through interactive and visually rich analytics.
Image
Description
The Tableau Shopify Performance Dashboard V1 provides a centralized view of your Shopify store's performance through interactive and visually rich analytics. Designed for eCommerce businesses, store managers, and decision-makers, it enables users to monitor key metrics such as total revenue, orders, average order value (AOV), products sold, customer growth, refunds, conversion rate, and top-selling products. Interactive dashboards help analyze sales by product, collection, customer, sales channel, location, and reporting period, allowing businesses to identify trends and improve operational efficiency. Dynamic filters and drill-down capabilities make it easy to explore detailed performance insights and optimize sales strategies. Built with Tableau, the dashboard supports automated data connectivity and responsive visualizations, reducing manual reporting efforts. By consolidating Shopify sales and customer data into a single analytics platform, the dashboard improves business visibility, enhances reporting efficiency, and empowers organizations to make informed, data-driven decisions for sustainable eCommerce growth.
Sign in to unlock full template details
Features, requirements, and implementation details are visible only to signed-in users.
Key Features
Demo Link
Demo video/link will be available soon.
Software Requirements
Additional Considerations
One-time purchase
What You'll Receive
Dashboard Package
Implementation Services
Optional Customization