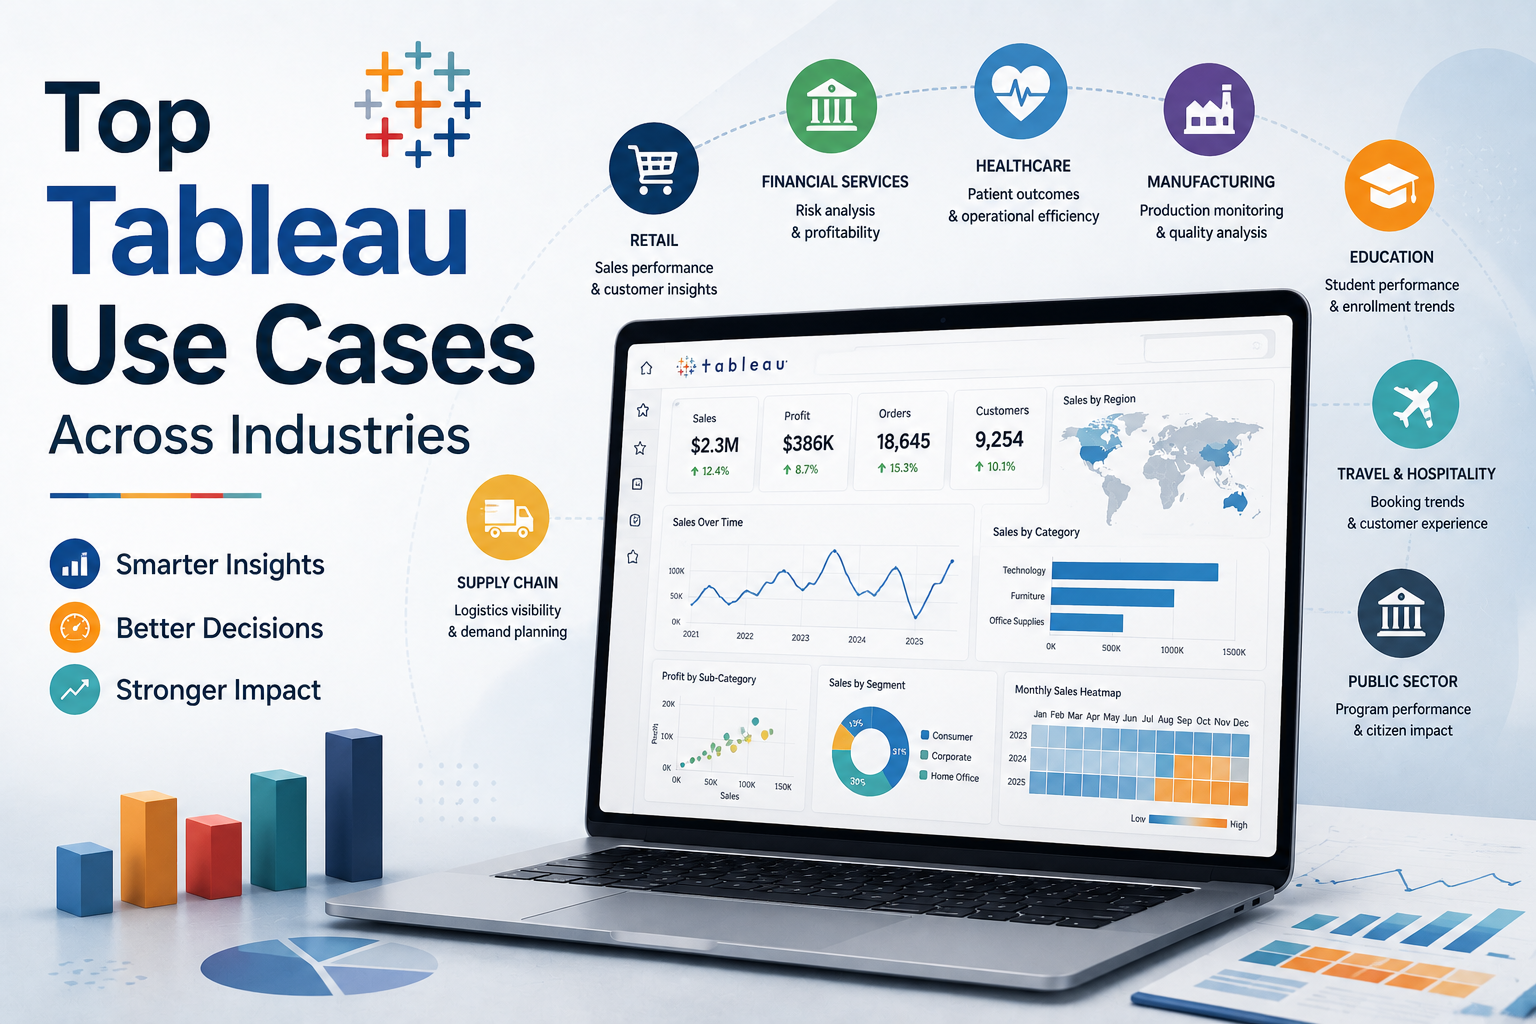
Top Tableau Use Cases Across Industries
As businesses continue generating enormous volumes of data, organizations increasingly rely on business intelligence platforms to transform raw information into meaningful insights. In this evolving analytics landscape, Tableau has become one of the most widely adopted tools for data visualization, interactive reporting, and enterprise analytics.
Modern companies no longer use analytics only for monthly reporting. Businesses now depend on real-time dashboards, predictive insights, KPI monitoring, and operational intelligence to improve decision-making across departments.
This growing demand for advanced analytics is why Tableau has gained popularity across industries such as:
- Healthcare
- Retail
- Finance
- Manufacturing
- Marketing
- Logistics
- Ecommerce
- Education
- Human resources
At KnexBI, organizations increasingly implement Tableau dashboards and enterprise reporting systems to improve operational visibility, automate analytics workflows, and build scalable business intelligence environments.
In this article, we’ll explore the top Tableau use cases across industries and understand how organizations use Tableau to solve real-world business challenges.
Why Tableau is Popular Across Industries
Before exploring specific use cases, it’s important to understand why Tableau is widely adopted by organizations globally.
Tableau helps businesses:
- Connect multiple data sources
- Create interactive dashboards
- Analyze large datasets
- Track KPIs
- Visualize trends
- Improve reporting efficiency
One of Tableau’s biggest strengths is its ability to simplify complex data analysis through intuitive visualizations and drag-and-drop dashboard creation.
Organizations use Tableau because it supports:
- Real-time analytics
- Self-service BI
- Enterprise reporting
- Data storytelling
- Cloud analytics
- Predictive intelligence
This flexibility makes Tableau suitable for both small businesses and large enterprises.
1. Healthcare Analytics and Patient Reporting
Healthcare organizations generate massive amounts of operational and clinical data daily.
Hospitals and healthcare providers use Tableau for:
- Patient monitoring
- Resource allocation
- Treatment analytics
- Hospital performance tracking
- Operational reporting
- Healthcare KPI dashboards
Healthcare analytics dashboards help organizations improve:
- Patient outcomes
- Operational efficiency
- Staff utilization
- Financial management
For example, hospitals can use Tableau dashboards to monitor:
- Bed occupancy rates
- Emergency response times
- Patient wait times
- Readmission rates
Real-time healthcare analytics improves decision-making in critical environments.
2. Retail Sales and Inventory Analytics
Retail businesses rely heavily on analytics for operational and revenue optimization.
Retail organizations use Tableau for:
- Sales tracking
- Inventory management
- Product performance analysis
- Customer behavior analytics
- Regional sales comparisons
- Seasonal trend forecasting
Retail dashboards provide insights into:
- Best-selling products
- Customer purchase patterns
- Stock availability
- Revenue growth
For ecommerce and retail brands, Tableau helps improve:
- Inventory planning
- Marketing performance
- Pricing strategies
- Customer experience
Interactive dashboards help businesses respond faster to changing market trends.
3. Financial Reporting and Business Performance Monitoring
Finance teams require highly accurate and real-time reporting systems.
Organizations use Tableau for:
- Financial KPI tracking
- Revenue analysis
- Profitability reporting
- Budget forecasting
- Expense monitoring
- Executive financial dashboards
Financial analytics dashboards help leadership teams monitor:
- Cash flow
- Operational costs
- ROI performance
- Revenue trends
- Financial risks
Tableau’s advanced visualization capabilities simplify complex financial reporting processes. This enables executives to make faster data-driven decisions.
4. Marketing Analytics and Campaign Performance Tracking
Marketing teams generate enormous amounts of campaign data from social media, advertising platforms, SEO tools, CRM systems, and email marketing platforms. Tableau helps marketers consolidate analytics into centralized dashboards.
Marketing teams use Tableau for:
- Campaign performance tracking
- Customer acquisition analysis
- Conversion rate monitoring
- Website traffic analytics
- ROI reporting
- Attribution analysis
Interactive marketing dashboards improve visibility into:
- Ad spend efficiency
- Lead generation performance
- Audience engagement
- Channel effectiveness
This enables businesses to optimize marketing strategies more effectively.
5. Manufacturing and Supply Chain Analytics
Manufacturing organizations require real-time operational visibility to maintain efficiency.
Tableau supports manufacturing analytics through:
- Production monitoring
- Supply chain visibility
- Inventory tracking
- Equipment performance analysis
- Quality control dashboards
- Operational KPI reporting
Manufacturers use Tableau dashboards to monitor:
- Production delays
- Machine downtime
- Warehouse operations
- Logistics performance
- Supplier efficiency
Real-time operational analytics helps reduce inefficiencies and improve productivity.
6. Human Resources and Workforce Analytics
HR departments increasingly use analytics to improve workforce management.
Organizations use Tableau for:
- Employee performance tracking
- Recruitment analytics
- Attrition analysis
- Workforce diversity reporting
- HR KPI dashboards
- Employee engagement analysis
HR dashboards help businesses monitor:
- Hiring trends
- Employee turnover
- Department productivity
- Training effectiveness
Analytics-driven HR strategies improve organizational planning and workforce optimization.
7. Ecommerce Analytics and Customer Insights
Ecommerce businesses depend heavily on data for growth optimization.
Tableau dashboards help ecommerce companies analyze:
- Sales performance
- Customer behavior
- Cart abandonment rates
- Product demand
- Customer retention
- Marketing ROI
Businesses can identify:
- High-performing products
- Seasonal purchasing patterns
- Revenue opportunities
- Customer segmentation insights
Interactive ecommerce dashboards improve operational decision-making significantly.
8. Logistics and Transportation Analytics
Logistics companies require real-time operational visibility across supply chains.
Tableau helps logistics businesses monitor:
- Shipment tracking
- Fleet performance
- Delivery efficiency
- Route optimization
- Fuel consumption
- Operational delays
Transportation analytics dashboards improve:
- Delivery planning
- Operational efficiency
- Customer service
- Cost management
Real-time logistics dashboards enable faster response to operational disruptions.
9. Education and Student Performance Analytics
Educational institutions increasingly use analytics for operational and academic planning.
Schools, universities, and training institutions use Tableau for:
- Student performance tracking
- Enrollment analysis
- Attendance reporting
- Resource allocation
- Academic KPI monitoring
Education dashboards help administrators identify:
- Student success trends
- Retention rates
- Department performance
- Institutional efficiency
Analytics-driven education systems improve academic decision-making.
10. Real Estate and Property Analytics
Real estate firms use Tableau for:
- Property performance tracking
- Sales analysis
- Market trend visualization
- Investment reporting
- Geographic analysis
Interactive dashboards help businesses analyze:
- Property demand
- Rental performance
- Regional growth patterns
- Investment opportunities
Geospatial analytics capabilities make Tableau highly valuable for real estate intelligence.
11. Executive Reporting and Leadership Dashboards
Executives require high-level visibility into business performance.
Organizations use Tableau dashboards to centralize:
- Financial KPIs
- Sales metrics
- Operational performance
- Marketing analytics
- Strategic insights
Executive dashboards simplify complex enterprise reporting into easy-to-understand visual summaries. Leadership teams can monitor business performance in real time without reviewing multiple disconnected reports.
12. Customer Service and Support Analytics
Customer experience has become a major business priority.
Organizations use Tableau to analyze:
- Ticket resolution times
- Customer satisfaction scores
- Support performance
- Service-level agreements (SLAs)
- Customer feedback trends
Customer support dashboards help businesses improve:
- Response efficiency
- Customer retention
- Service quality
Analytics-driven customer support improves overall customer experience.
13. Energy and Utility Analytics
Energy companies use Tableau for:
- Consumption tracking
- Operational monitoring
- Infrastructure analytics
- Energy efficiency reporting
- Sustainability dashboards
Real-time dashboards help utility providers monitor:
- Resource usage
- Equipment performance
- Demand forecasting
- Service disruptions
Analytics improves operational reliability and planning efficiency.
14. Government and Public Sector Reporting
Government organizations increasingly use Tableau for:
- Public data visualization
- Budget analysis
- Population analytics
- Resource planning
- Policy reporting
Interactive dashboards improve:
- Transparency
- Public communication
- Decision-making efficiency
Government agencies benefit from centralized analytics systems.
15. Insurance and Risk Analytics
Insurance companies rely heavily on data analysis for:
- Risk assessment
- Claims analytics
- Fraud detection
- Customer segmentation
- Policy performance monitoring
Tableau dashboards help insurers improve:
- Operational efficiency
- Claims processing
- Financial forecasting
Advanced analytics supports more accurate business decisions.
Common Benefits of Tableau Across Industries
Although use cases vary by industry, most organizations experience similar benefits when implementing Tableau.
Improved Data Visualization
Tableau simplifies complex datasets through interactive charts, KPI dashboards, geospatial visualizations, and real-time analytics. This improves business understanding significantly.
Faster Decision-Making
Centralized dashboards help organizations identify trends quickly, respond to operational issues faster, and monitor business performance continuously. Real-time analytics improves agility.
Better Collaboration
Shared dashboards improve communication across teams and departments. Organizations can align strategies using centralized data visibility.
Self-Service Analytics
Business users can create reports independently without heavy IT dependency. This accelerates analytics adoption across organizations.
Enterprise Scalability
Tableau supports cloud analytics, enterprise reporting, large datasets, and real-time dashboards. This makes it suitable for growing businesses.
Challenges Organizations Face with Tableau
Despite its strengths, organizations may face challenges such as:
- Dashboard performance issues
- Poor data modeling
- Governance complexity
- Data silos
- User adoption barriers
Successful Tableau implementations require:
- Proper architecture
- Performance optimization
- Governance strategies
- Data quality management
Technology alone is not enough without scalable analytics planning.
How KnexBI Helps Businesses Implement Tableau Solutions
At KnexBI, businesses implement Tableau solutions for executive reporting, enterprise dashboards, operational analytics, marketing intelligence, and real-time business monitoring.
KnexBI helps organizations:
- Design scalable Tableau architectures
- Improve dashboard performance
- Build industry-specific analytics systems
- Optimize reporting workflows
- Modernize enterprise BI environments
This enables businesses to maximize the value of modern data visualization and analytics technologies.
Future of Tableau Across Industries
The future of Tableau analytics increasingly involves AI-powered insights, predictive analytics, real-time intelligence, cloud-native reporting, embedded analytics, and automated dashboard generation. As organizations become more data-driven, Tableau will continue playing a major role in enterprise business intelligence transformation. Businesses investing in scalable analytics strategies today will be better positioned for future growth.
Tableau has become one of the most versatile and widely adopted analytics platforms across industries. Organizations use it for healthcare analytics, retail reporting, financial dashboards, manufacturing intelligence, HR analytics, marketing reporting, supply chain visibility, and executive dashboards. Its ability to transform raw data into interactive visual intelligence helps businesses improve decision-making, operational efficiency, and strategic planning.
As analytics continues evolving in 2026 and beyond, Tableau will remain a critical platform for organizations seeking scalable, data-driven business intelligence solutions.
