Modern businesses generate massive volumes of data from marketing platforms, CRM systems, financial tools, and operational software. However, raw data alone cannot drive better decisions unless it is transformed into clear and actionable insights.
This is where Looker Studio become a powerful solution. Looker Studio enables organizations to convert complex datasets into interactive dashboards, automated reports, and real-time visual analytics.
With its seamless integration across the Google ecosystem and various third-party platforms, Looker Studio allows teams to centralize reporting, track key performance indicators (KPIs), and make faster data-driven decisions.
In this guide, we explore what Looker Studio is, its key features, benefits, and why it has become one of the most popular data visualization tools for modern businesses.
What Is Looker Studio?
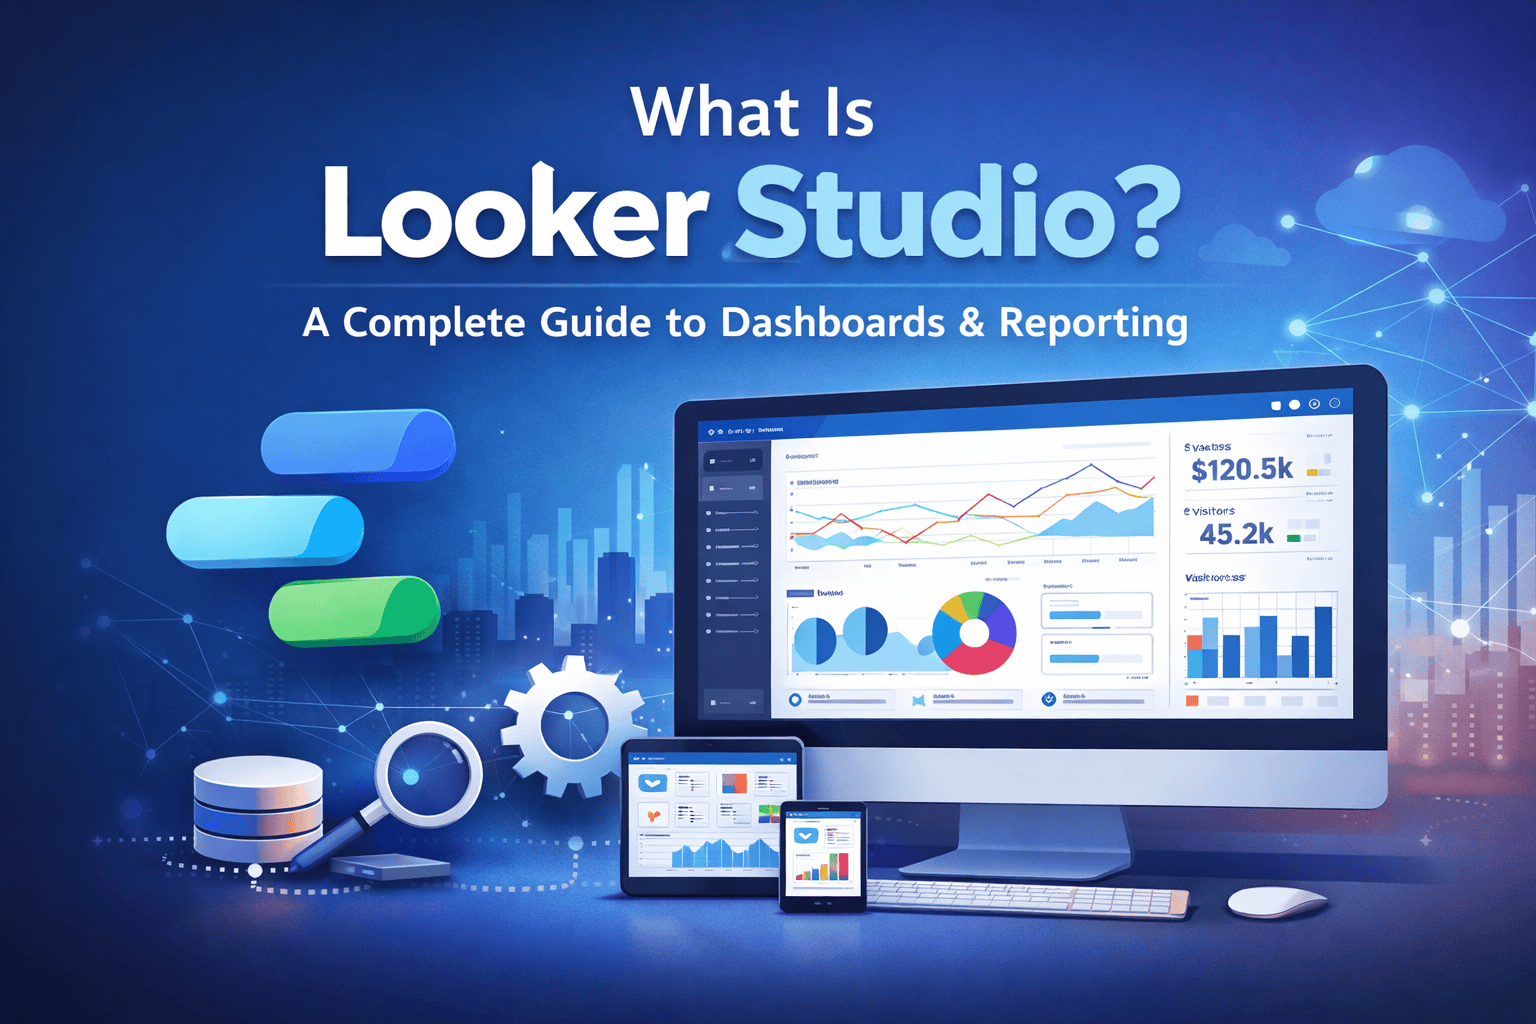
Looker Studio is a cloud-based business intelligence and data visualization platform that helps users transform raw data into interactive dashboards and shareable reports.
Originally launched as Google Data Studio, the platform was later rebranded to Looker Studio after the acquisition of Looker by Google.
The tool allows users to connect multiple data sources, build visual reports, and share insights across teams in real time.
Unlike traditional reporting tools that require manual updates, Looker Studio dashboards automatically refresh when the underlying data changes.
Why Businesses Are Adopting Looker Studio
Organizations across industries are adopting Looker Studio because it simplifies reporting and enables real-time analytics.
Some of the key advantages include:
Real-Time Data Visualization
Looker Studio connects directly to live data sources, ensuring dashboards always reflect the most recent information.
Seamless Google Ecosystem Integration
The platform integrates natively with tools such as Google Analytics, Google Ads, Google Sheets, and BigQuery. This makes it especially valuable for marketing and digital analytics teams.
Interactive Dashboards
Users can filter, drill down, and explore datasets dynamically through interactive charts and visual components.
Easy Collaboration
Reports can be shared securely across teams, clients, and stakeholders with controlled access permissions.
Automated Reporting
Looker Studio eliminates manual reporting by automatically updating dashboards whenever connected data changes.
Key Features of Looker Studio
Looker Studio offers powerful capabilities for building scalable analytics solutions.
- Interactive Dashboards: Create visually engaging dashboards with charts, scorecards, tables, and filters.
- Data Source Connectivity: Connect to hundreds of data sources including marketing platforms, CRM systems, spreadsheets, and databases.
- Customizable Visualizations: Design reports tailored to specific business goals, KPIs, and workflows.
- Embedded Analytics: Embed dashboards directly into websites, portals, or applications.
- Shareable Reporting: Easily share reports with clients, teams, or stakeholders through secure links.
Common Use Cases for Looker Studio
Businesses use Looker Studio across multiple departments and industries.
- Marketing Performance Dashboards: Track campaign performance, ad spend, conversions, and ROI from multiple advertising platforms.
- Website Analytics Dashboards: Visualize website traffic, user behavior, and engagement metrics.
- Sales Performance Reports: Monitor revenue trends, sales pipelines, and customer acquisition metrics.
- Executive KPI Dashboards: Provide leadership teams with a single source of truth for strategic decision-making.
- Client Reporting Dashboards: Marketing agencies often use Looker Studio to deliver automated client performance reports.
Looker Studio vs Traditional Reporting Tools
Traditional reporting methods often involve manual data extraction, spreadsheet consolidation, and static reports. Looker Studio offers a modern alternative:
| Traditional Reporting | Looker Studio |
|---|---|
| Manual report creation | Automated dashboards |
| Static charts | Interactive visualizations |
| Limited collaboration | Real-time sharing |
| Time-consuming updates | Live data refresh |
This shift allows teams to focus on insights rather than manual data preparation.
Best Practices for Building Effective Looker Studio Dashboards
To maximize the value of Looker Studio dashboards, organizations should follow several best practices.
- Define Clear KPIs: Focus dashboards around business goals and measurable metrics.
- Simplify Visualizations: Avoid clutter and prioritize clarity when presenting insights.
- Use Consistent Design: Maintain consistent colors, layouts, and formatting for better readability.
- Optimize Data Sources: Ensure data pipelines are clean and structured to maintain dashboard performance.
- Enable Interactivity: Add filters, drilldowns, and date controls to improve user exploration.
The Future of Data Visualization with Looker Studio
As businesses continue to adopt data-driven strategies, the demand for accessible analytics tools will only grow.
Looker Studio is positioned as a leading solution because it combines cloud scalability, real-time reporting, seamless integrations, and collaborative analytics. These capabilities make it ideal for organizations seeking modern business intelligence solutions without heavy infrastructure costs.
Sum It Up
Data visualization plays a critical role in helping organizations understand performance, uncover insights, and drive strategic decisions.
With powerful features and deep integration across the Google ecosystem, Looker Studio enables businesses to transform raw data into meaningful insights through interactive dashboards and automated reporting.
For companies looking to streamline reporting and empower teams with real-time analytics, Looker Studio offers a flexible and scalable solution.
