Modern enterprises are generating more data than ever before. From operational systems and customer interactions to cloud applications and IoT devices, organizations continuously produce massive volumes of information that influence business decisions.
However, collecting data is no longer the biggest challenge. The real challenge is transforming complex enterprise data into meaningful insights that decision-makers can understand and act upon quickly. This is why data visualization has become one of the most critical components of enterprise analytics.
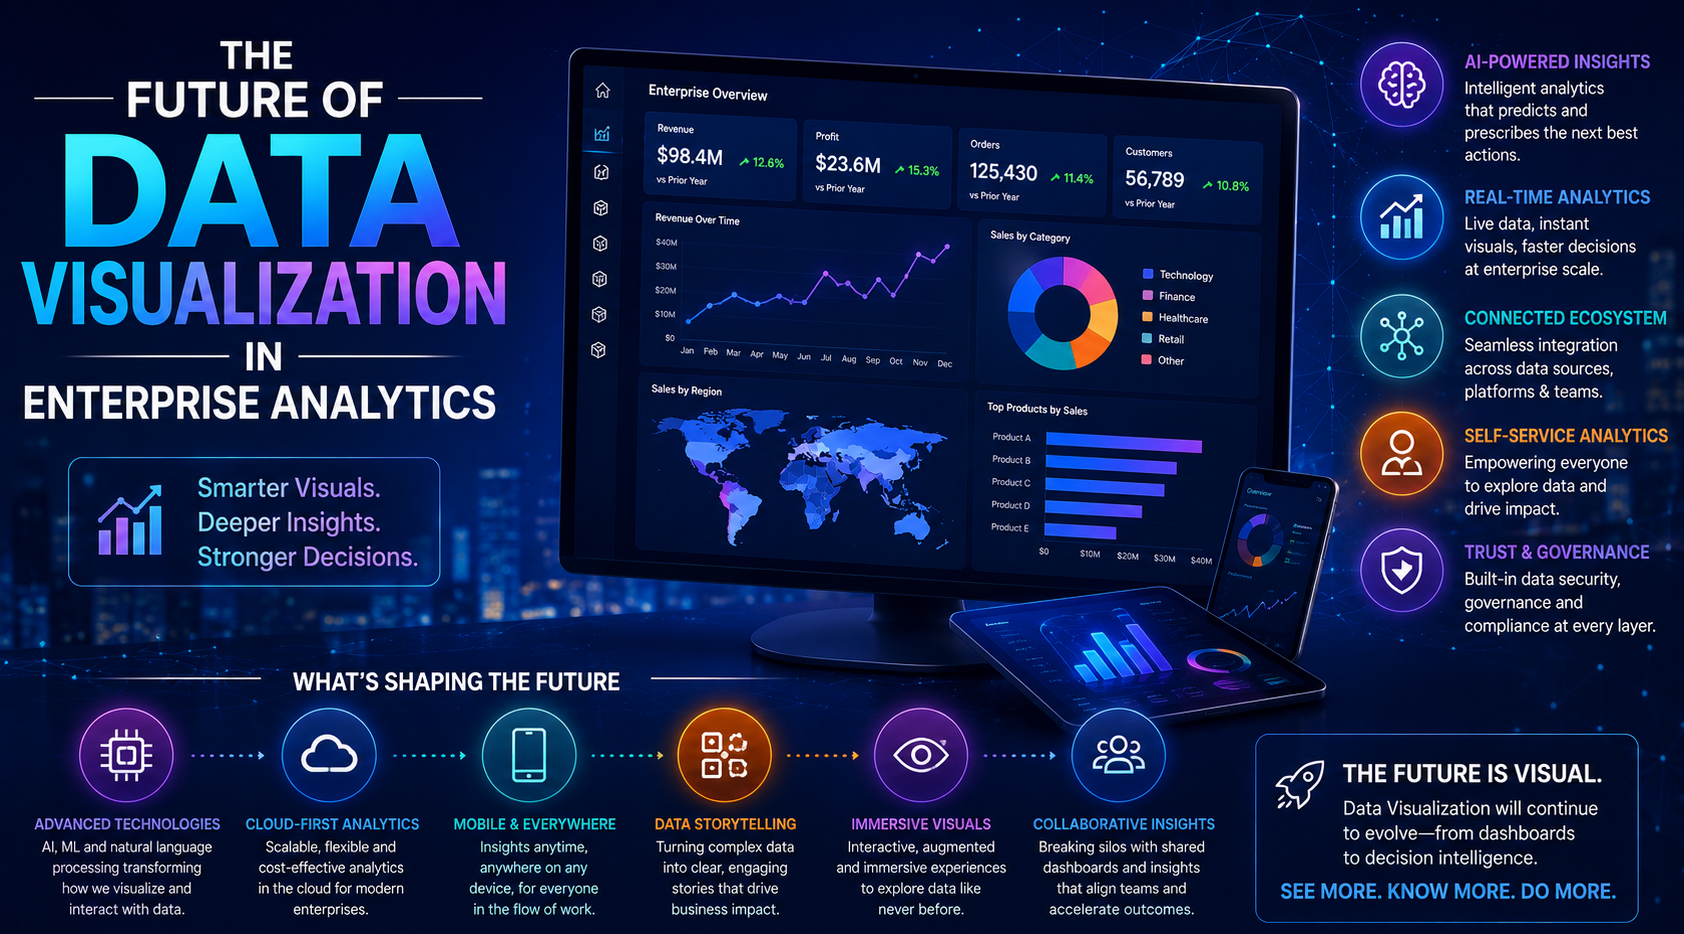
In 2026 and beyond, data visualization is evolving rapidly with advancements in:
- Artificial intelligence
- Real-time analytics
- Cloud computing
- Predictive intelligence
- Automation
- Embedded analytics
- Self-service business intelligence
Modern enterprises are no longer satisfied with static dashboards and basic reports. Organizations now demand intelligent, interactive, and scalable visual analytics environments capable of supporting faster and more strategic decision-making.
At KnexBI, businesses increasingly adopt advanced data visualization solutions using platforms such as Tableau, Microsoft Power BI, and Looker Studio to modernize enterprise reporting and analytics ecosystems.
In this article, we’ll explore the future of data visualization in enterprise analytics, emerging technologies shaping the industry, and how businesses can prepare for the next generation of visual intelligence.
The Evolution of Enterprise Analytics
Enterprise analytics has changed dramatically over the last decade. Traditional business intelligence systems primarily focused on static reports, spreadsheets, manual dashboards, and historical analysis. These systems often lacked interactivity, real-time insights, predictive capabilities, and user accessibility.
Modern enterprises now require analytics systems capable of:
- Processing large-scale data
- Supporting real-time operations
- Enabling self-service reporting
- Delivering predictive intelligence
As analytics environments become more advanced, data visualization is evolving from simple chart creation into intelligent business decision systems.
Why Data Visualization is Becoming More Important
Enterprise data environments are becoming increasingly complex. Organizations manage data across cloud platforms, ERP systems, CRM software, IoT devices, ecommerce systems, financial applications, and customer analytics platforms. Without effective visualization, enterprise data becomes difficult to interpret and utilize.
Visualization helps enterprises:
- Simplify complexity
- Improve reporting
- Identify trends
- Accelerate decisions
- Enhance communication across departments
The future of enterprise analytics will rely heavily on visual intelligence to support operational efficiency and strategic growth.
1. AI-Powered Data Visualization Will Transform Analytics
Artificial intelligence is rapidly changing how organizations interact with data. AI-powered visualization platforms are beginning to automate dashboard generation, trend detection, anomaly identification, predictive insights, and natural language analysis.
Instead of manually building reports, future analytics systems will increasingly recommend visualizations, KPIs, insights, and business actions automatically. This helps enterprises significantly reduce manual reporting overhead, uncover hidden trends, and boost decision-making speed. Future dashboards will natively explain the "why" behind revenue changes, operational anomalies, and customer behavior shifts.
2. Real-Time Data Visualization Will Become Standard
Real-time analytics is becoming essential for modern enterprises. Businesses increasingly require immediate visibility into operational performance, customer behavior, inventory levels, financial activity, and supply chain operations.
Future enterprise dashboards will provide continuously updating visual insights with minimal latency. Industries such as ecommerce, healthcare, logistics, finance, and manufacturing will especially rely on real-time visual monitoring systems to respond faster, reduce operational risk, and improve agility. As data infrastructure improves, real-time visualization will become a standard expectation rather than a premium feature.
3. Predictive and Prescriptive Analytics Will Expand
Traditional analytics primarily explains what happened in the past. Future visualization systems will increasingly focus on predictive analytics, forecasting, and prescriptive recommendations.
Enterprises will use visual dashboards to predict customer churn, sales trends, inventory demand, and market behavior. Prescriptive analytics will go even further by recommending specific business actions—such as marketing optimization choices, supply chain adjustments, or financial risk mitigation strategies—evolving visualization from passive reporting into active decision intelligence.
4. Embedded Analytics Will Grow Rapidly
Embedded analytics is becoming one of the fastest-growing enterprise trends. Instead of requiring users to access separate BI platforms, organizations increasingly integrate visual analytics directly into CRM systems, ERP software, ecommerce platforms, customer portals, and day-to-day operational applications.
This allows employees to access insights within their existing workflows, improving productivity, internal adoption, and decision-making efficiency.
5. Self-Service Analytics Will Continue Expanding
Enterprises are moving away from IT-dependent reporting systems. Future analytics environments will prioritize self-service visualization tools that allow business users to create dashboards, explore data, customize reports, and generate insights independently.
This democratization of analytics improves organizational agility, reporting speed, and overall accessibility. Modern visualization platforms increasingly focus on user-friendly interfaces and low-code functionality.
6. Conversational Analytics Will Become Mainstream
Natural language querying is rapidly becoming more advanced. Future enterprise analytics platforms will allow users to ask questions conversationally, generate dashboards instantly, and receive AI-generated explanations.
"Show quarterly revenue trends"
"Why did customer churn increase?"
"Which products underperformed this month?"
Conversational analytics will reduce technical barriers and improve analytics adoption across organizations as integrated AI assistants become standard.
7. Cloud-Native Visualization Platforms Will Dominate
Cloud computing continues reshaping enterprise analytics infrastructure. Future visualization systems will increasingly operate through cloud-native architectures, scalable cloud data warehouses, and distributed analytics environments that provide massive scalability, lower infrastructure costs, and seamless remote collaboration.
Modern enterprises increasingly deploy modern data storage engines like Snowflake, Google BigQuery, and Microsoft Azure alongside their visualization layers to modernize enterprise reporting.
8. Data Storytelling Will Become More Strategic
Data storytelling is becoming increasingly important in enterprise decision-making. Future visualization systems will focus not only on displaying charts but also on communicating business narratives, strategic context, and operational insights clearly.
Visualization platforms will natively support interactive presentations, narrative dashboard views, and automated insight callouts, giving data-driven companies a stronger strategic advantage.
9. Mobile and Cross-Platform Analytics Will Expand
Enterprise users increasingly access analytics from smartphones, tablets, laptops, and remote environments. Future visualization systems must natively support responsive dashboards, mobile optimization, and unified cross-platform layouts, especially as remote and hybrid work environments expand.
10. Advanced Visualization Techniques Will Evolve
Traditional charts and graphs are evolving into more sophisticated visual experiences. Future enterprise analytics will increasingly use interactive layers, augmented analytics, immersive visual exploration, and intelligent automated visualization recommendations to help organizations explore complex datasets more intuitively.
Industries Driving Enterprise Visualization Growth
Several key industries are heavily accelerating visualization adoption:
- Healthcare: Patient tracking and care delivery optimization
- Finance & Insurance: Real-time risk modeling and asset tracking
- Retail & Ecommerce: Multi-channel funnel optimization and live sales grids
- Logistics & Manufacturing: Supply chain bottlenecks and plant downtime monitoring
Major Challenges in the Future of Enterprise Visualization
Although visualization technology continues advancing, enterprises still face important challenges such as data governance confusion, dashboard overload, security risks, scalability issues, and unoptimized data quality management.
Future success depends not only on adopting the latest tool but also on careful, strategic analytics planning and robust data architecture.
Enterprise Visualization Best Practices for the Future
Organizations preparing for the future should focus on several key strategies:
- Build Scalable Analytics Infrastructure: Ensure future systems support large-scale enterprise data volume changes.
- Prioritize Data Governance: Guard dashboard reliability by maintaining secure, clean data ingestion pipelines.
- Invest in Real-Time Capabilities: Improve operational agility by deploying live data connections where necessary.
- Focus on User Experience: Design clean visual interfaces that keep reports understandable for non-technical audiences.
How KnexBI Helps Enterprises Modernize Data Visualization
At KnexBI, we help organizations modernize enterprise analytics through interactive dashboards, cloud analytics, executive reporting systems, real-time monitoring solutions, and scalable business intelligence architectures.
KnexBI helps businesses:
- Optimize and tune slow enterprise reporting systems
- Improve cross-department data accessibility and user adoption
- Build AI-ready data semantic models
- Modernize visual workflows to remove manual work
Future Enterprise Analytics Growth Trend
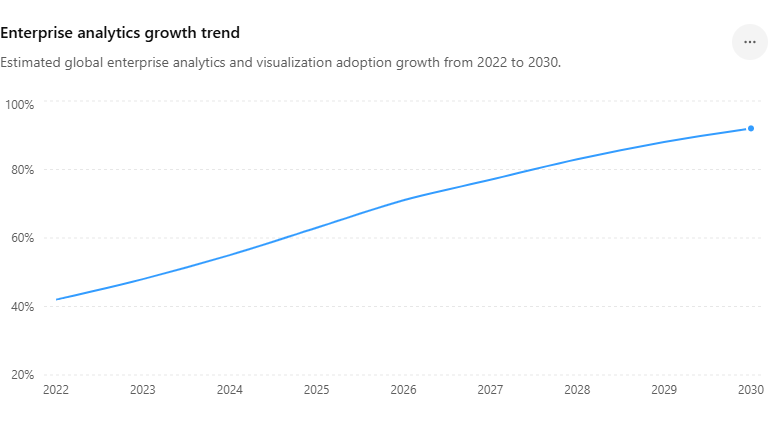
As organizations continue accelerating digital transformation in 2026 and beyond, enterprises that invest in scalable, intelligent, and user-friendly visualization systems will gain stronger competitive advantages in the increasingly data-driven business landscape.
